UPDATE: Since ECK operator 1.7 there is a new way to deploy stack monitoring. I’ve added the section at the end to cover for this. The old method still works and depending on your use case you can still use the old method versus new. The main difference between the OLD and NEW is that the OLD method uses filebeat and metricbeat pods while the new method uses filebeat and metricbeat sidecar containers.
Lets get started with monitoring your elastic stack in kubernetes. There are multiple ways of doing this and I will divide this up into 3 sections, using elasticsearchRef & kibanaRef to monitor your stack in the same k8s cluster, not using the Ref but actually plugging in the values for monitoring in the same k8s cluster, sending monitoring to an external cluster outside of your k8s cluster. All 3 methods will use the same basic concept and will utilize both metricbeat & filebeat to send your monintoring data.
Current release version is ECK 2.0 and I will use elasticsearch 7.17.0 for the excercise.
When thinking about stack monitoring there are 3 parts.
- Production cluster – the cluster that you want to monitor
- beats – metricbeat to send metrics data and filebeat to send logs
- Monitoring cluster – the cluster where the data is sent to so that you can view/analyze and alert from the data collected.
Stack monitoring in the same k8s cluster using Refs
This is the simplest one to setup and use. For this example we will use the yaml that elastic already provides
$ wget https://raw.githubusercontent.com/elastic/cloud-on-k8s/2.0/config/recipes/beats/stack_monitoring.yamlCouple of items that I wanted to note from the yaml.
- Production cluster in the yaml is named elasticsearch
- Production ES & KB has labels named
scrape: esandscrape: kbso that metricbeats can filter for these labels - the manifest is using
elasticsearchRef&kibanaRefto gather endpoint,username, & password information - versions will be changed from
7.16.2to7.17.0since that is the most current today. - for my lab I will change the count of elasticsearch instances to 1 instead of 3
count: 3->count: 1
$ kubectl apply -f stack_monitoring.yaml && kubectl get pods -w

beat.beat.k8s.elastic.co/metricbeat created
clusterrole.rbac.authorization.k8s.io/metricbeat created
serviceaccount/metricbeat created
clusterrolebinding.rbac.authorization.k8s.io/metricbeat created
beat.beat.k8s.elastic.co/filebeat created
clusterrole.rbac.authorization.k8s.io/filebeat created
serviceaccount/filebeat created
clusterrolebinding.rbac.authorization.k8s.io/filebeat created
elasticsearch.elasticsearch.k8s.elastic.co/elasticsearch created
kibana.kibana.k8s.elastic.co/kibana created
elasticsearch.elasticsearch.k8s.elastic.co/elasticsearch-monitoring created
kibana.kibana.k8s.elastic.co/kibana-monitoring created
NAME                                    READY   STATUS    RESTARTS   AGE
elasticsearch-monitoring-es-default-0   0/1     Pending   0          0s
elasticsearch-monitoring-es-default-0   0/1     Pending   0          0s
elasticsearch-monitoring-es-default-0   0/1     Pending   0          0s
elasticsearch-monitoring-es-default-0   0/1     Init:0/2   0          0s
elasticsearch-es-default-0              0/1     Pending    0          0s
elasticsearch-es-default-0              0/1     Pending    0          0s
elasticsearch-es-default-0              0/1     Pending    0          0s
elasticsearch-es-default-0              0/1     Init:0/2   0          3s
elasticsearch-monitoring-es-default-0   0/1     Init:0/2   0          4s
elasticsearch-es-default-0              0/1     Init:0/2   0          5s
metricbeat-beat-metricbeat-68fcf6c5b8-4jhw9   0/1     Pending    0          0s
metricbeat-beat-metricbeat-68fcf6c5b8-4jhw9   0/1     Pending    0          0s
kibana-monitoring-kb-5468c646cc-vgfz8         0/1     Pending    0          0s
kibana-monitoring-kb-5468c646cc-vgfz8         0/1     Pending    0          0s
kibana-kb-79cc6df95c-2rh95                    0/1     Pending    0          0s
kibana-kb-79cc6df95c-2rh95                    0/1     Pending    0          0s
elasticsearch-monitoring-es-default-0         0/1     Init:0/2   0          6s
elasticsearch-es-default-0                    0/1     Init:0/2   0          7s
filebeat-beat-filebeat-q8z87                  0/1     Pending    0          0s
filebeat-beat-filebeat-q8z87                  0/1     Pending    0          0s
elasticsearch-monitoring-es-default-0         0/1     Init:0/2   0          7s
metricbeat-beat-metricbeat-68fcf6c5b8-4jhw9   0/1     ContainerCreating   0          2s
elasticsearch-es-default-0                    0/1     Init:0/2            0          8s
kibana-monitoring-kb-5468c646cc-vgfz8         0/1     Init:0/1            0          4s
kibana-kb-79cc6df95c-2rh95                    0/1     Init:0/1            0          5s
filebeat-beat-filebeat-q8z87                  0/1     ContainerCreating   0          3s
kibana-monitoring-kb-5468c646cc-vgfz8         0/1     PodInitializing     0          6s
kibana-kb-79cc6df95c-2rh95                    0/1     PodInitializing     0          7s
kibana-kb-79cc6df95c-2rh95                    0/1     Running             0          8s
kibana-monitoring-kb-5468c646cc-vgfz8         0/1     Running             0          8s
elasticsearch-es-default-0                    0/1     Init:1/2            0          13s
elasticsearch-monitoring-es-default-0         0/1     Init:1/2            0          14s
elasticsearch-es-default-0                    0/1     PodInitializing     0          14s
elasticsearch-es-default-0                    0/1     Running             0          15s
elasticsearch-monitoring-es-default-0         0/1     Running             0          15s
metricbeat-beat-metricbeat-68fcf6c5b8-4jhw9   1/1     Running             0          23s
elasticsearch-monitoring-es-default-0         1/1     Running             0          37s
elasticsearch-es-default-0                    1/1     Running             0          37s
filebeat-beat-filebeat-q8z87                  1/1     Running             0          41s
kibana-monitoring-kb-5468c646cc-vgfz8         1/1     Running             0          46s
kibana-kb-79cc6df95c-2rh95                    1/1     Running             0          51s

$ kubectl get pod

NAME                                          READY   STATUS    RESTARTS   AGE
elasticsearch-es-default-0                    1/1     Running   0          86s
elasticsearch-monitoring-es-default-0         1/1     Running   0          86s
filebeat-beat-filebeat-q8z87                  1/1     Running   0          79s
kibana-kb-79cc6df95c-2rh95                    1/1     Running   0          81s
kibana-monitoring-kb-5468c646cc-vgfz8         1/1     Running   0          81s
metricbeat-beat-metricbeat-68fcf6c5b8-4jhw9   1/1     Running   0          81s
Get passwords
$ kubectl get secrets | grep es-elastic-user

elasticsearch-es-elastic-user                            Opaque                                1      2m21s
elasticsearch-monitoring-es-elastic-user                 Opaque                                1      2m21s

$ kubectl get secret elasticsearch-es-elastic-user -o go-template='{{.data.elastic | base64decode}}'

MG9j39YOC6q48MSej2C8O51O # prod elastic user password

$ kubectl get secret elasticsearch-monitoring-es-elastic-user -o go-template='{{.data.elastic | base64decode}}'

36Y9CmT59p2y2ShoYp6O7c6L # monitoring elastic user password
Lets go take a look
$ kubectl port-forward service/kibana-monitoring-kb-http 5601

Forwarding from 127.0.0.1:5601 -> 5601
Forwarding from [::1]:5601 -> 5601
Login with elastic & 36Y9CmT59p2y2ShoYp6O7c6L
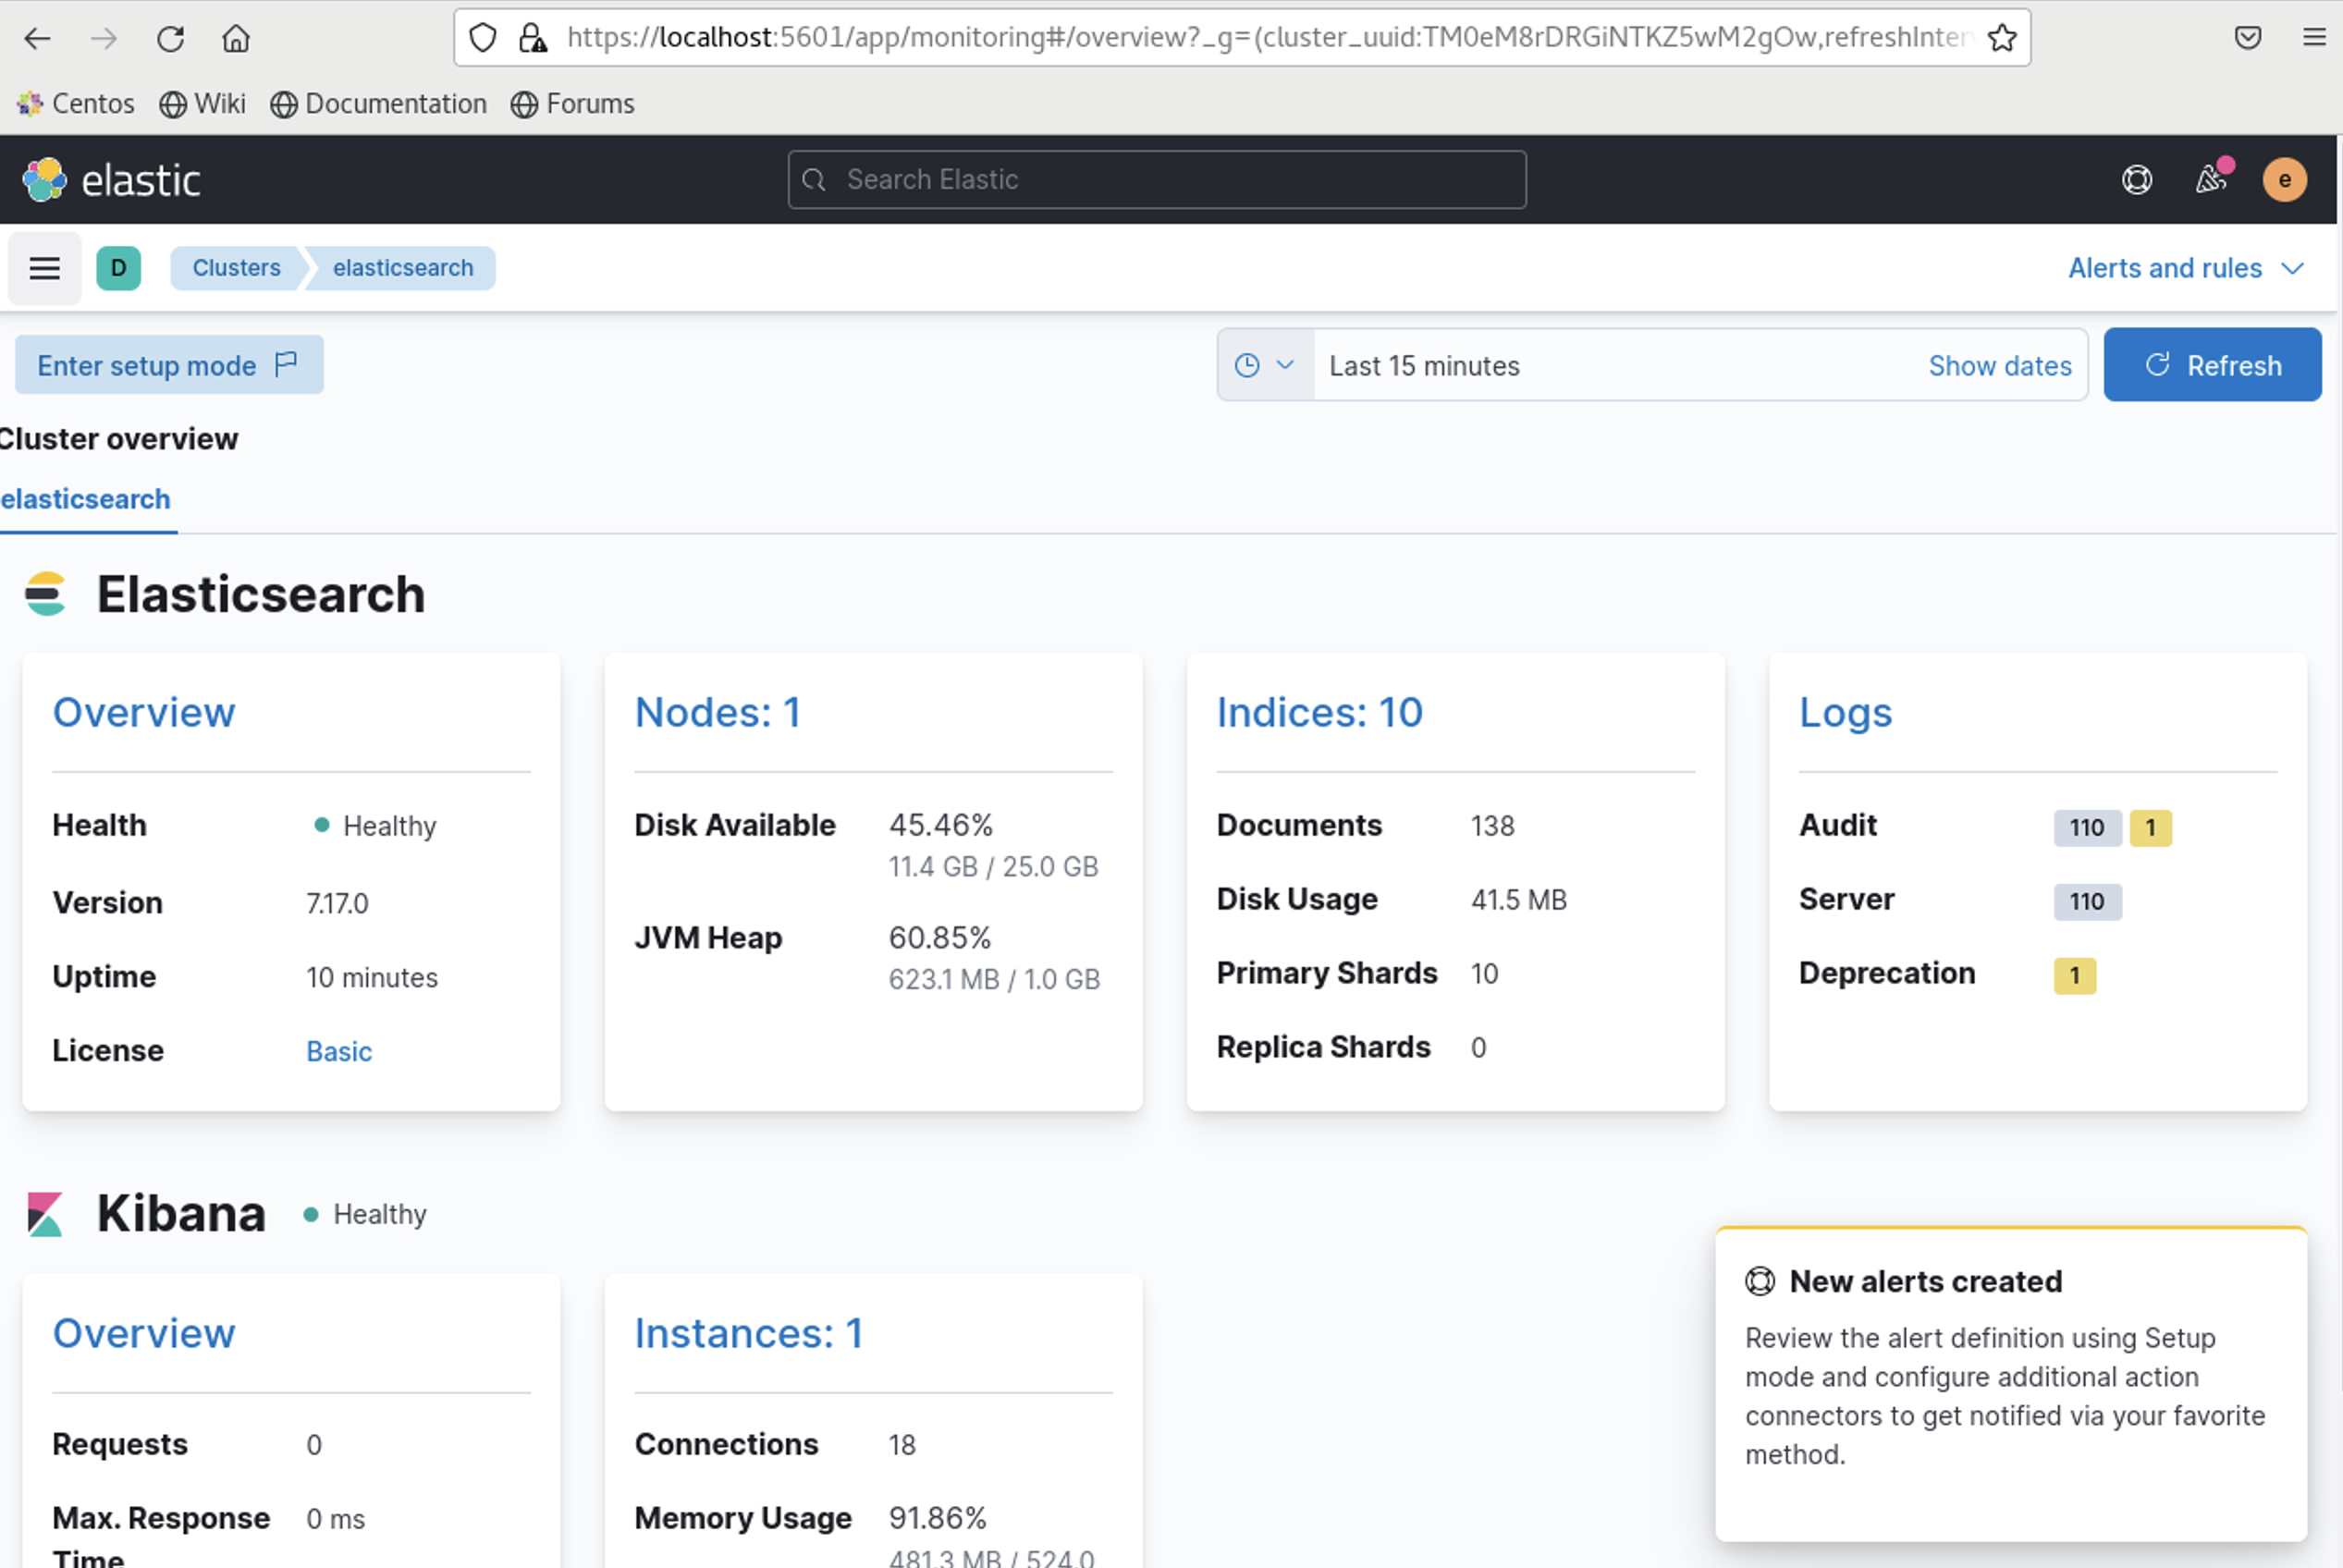
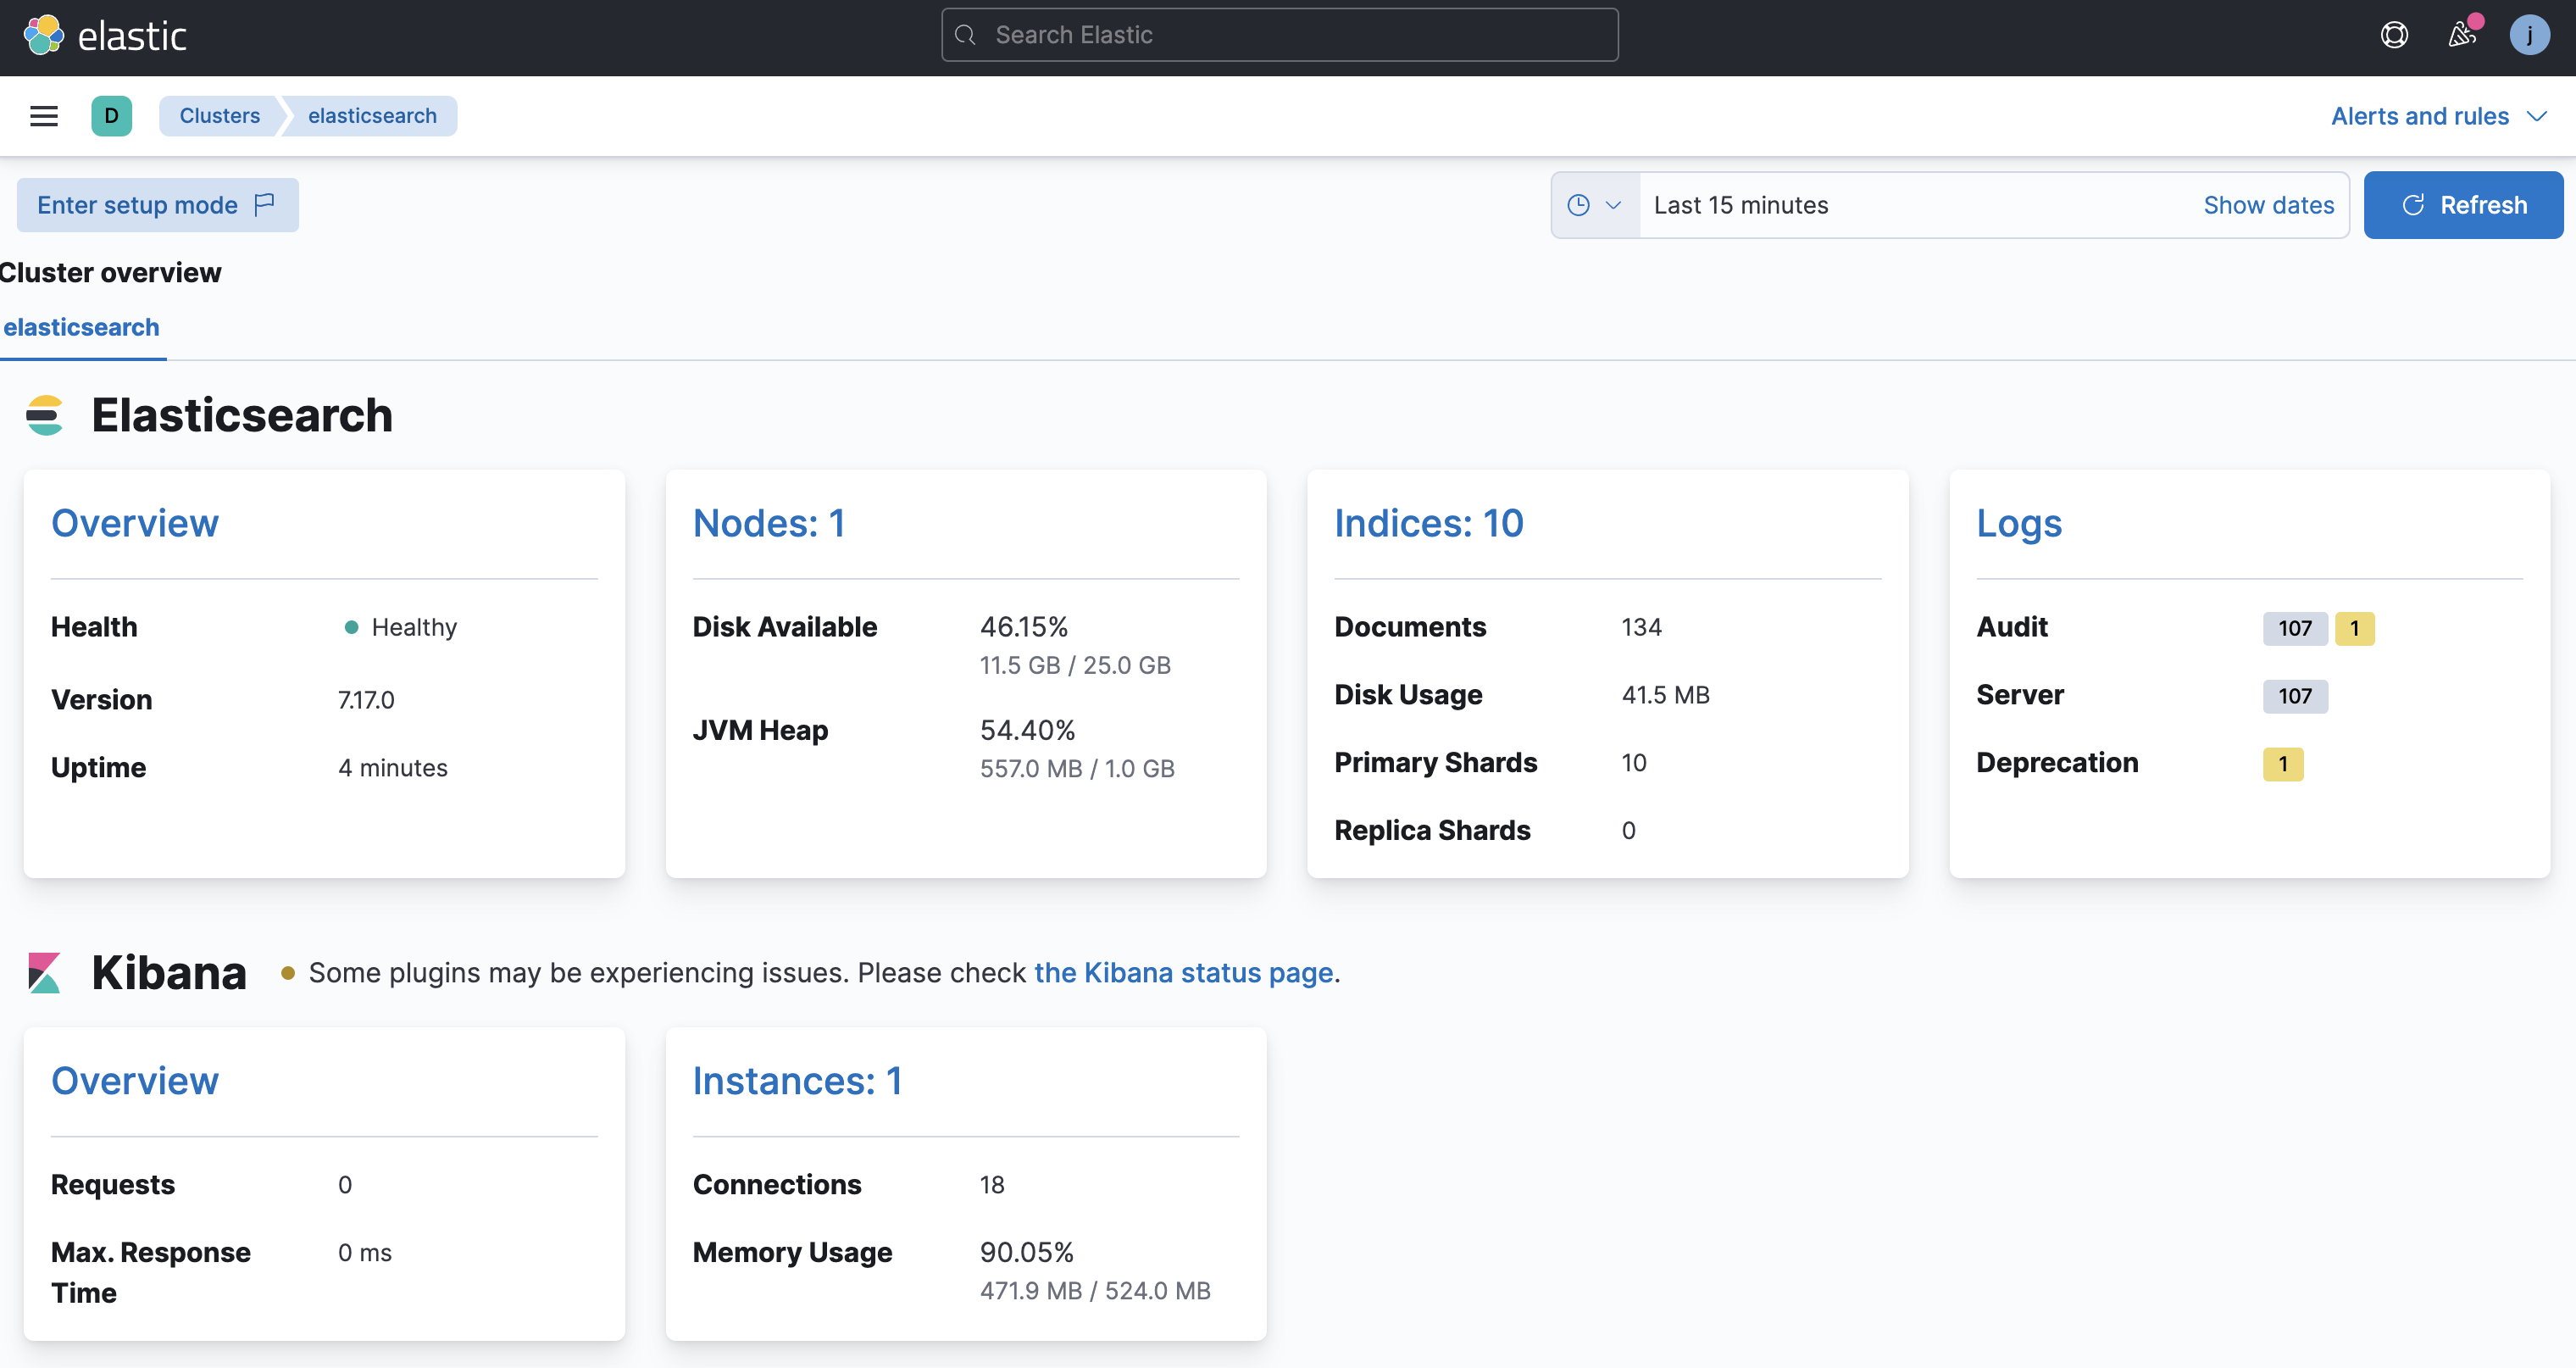
As you can see metricbeat is collecting metrics and filebeat is collecting logs and this is working flawlessly.
Stack monitoring in the same k8s cluster without using Refs(good for non ECK deployments)
I am going to break down the stack-monitoring.yaml from the previous example and break it down into 4 sections
- production cluster
---
# ES and Kibana resources
apiVersion: elasticsearch.k8s.elastic.co/v1
kind: Elasticsearch
metadata:
  name: elasticsearch
spec:
  version: 7.17.0
  nodeSets:
  - name: default
    count: 1
    config:
      node.store.allow_mmap: false
    podTemplate:
      metadata:
        labels:
          scrape: es
---
apiVersion: kibana.k8s.elastic.co/v1
kind: Kibana
metadata:
  name: kibana
spec:
  version: 7.17.0
  count: 1
  elasticsearchRef:
    name: elasticsearch
  config:
    # https://www.elastic.co/guide/en/kibana/current/monitoring-metricbeat.html
    monitoring.kibana.collection.enabled: false
  podTemplate:
    metadata:
      labels:
        scrape: kb
Please note the labels – we’ve kept the labels so that it can be reused for metricbeat and filebeat
$ kubectl apply -f production.yaml

elasticsearch.elasticsearch.k8s.elastic.co/elasticsearch created
kibana.kibana.k8s.elastic.co/kibana created

$ kubectl get secrets| grep es-elastic
elasticsearch-es-elastic-user                 Opaque                                1      11s

$ kubectl get secret elasticsearch-es-elastic-user -o go-template='{{.data.elastic | base64decode}}'

TrxxL249KG4C82bkqF58B5Q8- monitoring cluster
---
apiVersion: elasticsearch.k8s.elastic.co/v1
kind: Elasticsearch
metadata:
  name: elasticsearch-monitoring
spec:
  version: 7.17.0
  nodeSets:
  - name: default
    count: 1
    config:
      node.store.allow_mmap: false
---
apiVersion: kibana.k8s.elastic.co/v1
kind: Kibana
metadata:
  name: kibana-monitoring
spec:
  version: 7.17.0
  count: 1
  elasticsearchRef:
    name: elasticsearch-monitoring
  config:
    # enable the UI to reflect container level CPU usage, only displays info if CPU limits are set on the monitored ES cluster
    # https://www.elastic.co/guide/en/kibana/current/monitoring-settings-kb.html
    monitoring.ui.container.elasticsearch.enabled: true
$ kubectl apply -f monitoring.yaml
elasticsearch.elasticsearch.k8s.elastic.co/elasticsearch-monitoring created
kibana.kibana.k8s.elastic.co/kibana-monitoring created
$ kubectl get secrets| grep monit | grep es-elastic-user
elasticsearch-monitoring-es-elastic-user Opaque 1 74s
$ kubectl get secret elasticsearch-monitoring-es-elastic-user -o go-template='{{.data.elastic | base64decode}}'
gS0T4Qqt14529y4yR1UrXr6XWe now have 2 stand alone elastic clusters one for prod and another for monitoring
- metricbeat and its crds
---
# metricbeat resources
apiVersion: beat.k8s.elastic.co/v1beta1
kind: Beat
metadata:
  name: metricbeat
spec:
  type: metricbeat
  version: 7.17.0
  config:
    metricbeat:
      autodiscover:
        providers:
          - type: kubernetes
            scope: cluster
            hints.enabled: true
            templates:
              - condition:
                  contains:
                    kubernetes.labels.scrape: es
                config:
                  - module: elasticsearch
                    metricsets:
                      - ccr
                      - cluster_stats
                      - enrich
                      - index
                      - index_recovery
                      - index_summary
                      - ml_job
                      - node_stats
                      - shard
                    period: 10s
                    hosts: "https://${data.host}:${data.ports.https}"
                    username: ${MONITORED_ES_USERNAME}
                    password: ${MONITORED_ES_PASSWORD}
                    # WARNING: disables TLS as the default certificate is not valid for the pod FQDN
                    # TODO: switch this to "certificate" when available: https://github.com/elastic/beats/issues/8164
                    ssl.verification_mode: "none"
                    xpack.enabled: true
              - condition:
                  contains:
                    kubernetes.labels.scrape: kb
                config:
                  - module: kibana
                    metricsets:
                      - stats
                    period: 10s
                    hosts: "https://${data.host}:${data.ports.https}"
                    username: ${MONITORED_ES_USERNAME}
                    password: ${MONITORED_ES_PASSWORD}
                    # WARNING: disables TLS as the default certificate is not valid for the pod FQDN
                    # TODO: switch this to "certificate" when available: https://github.com/elastic/beats/issues/8164
                    ssl.verification_mode: "none"
                    xpack.enabled: true
    processors:
    - add_cloud_metadata: {}
    logging.json: true
    output.elasticsearch:
      hosts: [ "https://elasticsearch-monitoring-es-http:9200" ]
      username: ${MONITORING_ES_USERNAME}
      password: ${MONITORING_ES_PASSWORD}
      ssl:
        verification_mode: none
  deployment:
    podTemplate:
      spec:
        serviceAccountName: metricbeat
        automountServiceAccountToken: true
        # required to read /etc/beat.yml
        securityContext:
          runAsUser: 0
        containers:
        - name: metricbeat
          env:
          - name: MONITORED_ES_USERNAME
            value: elastic
          - name: MONITORED_ES_PASSWORD
            valueFrom:
              secretKeyRef:
                key: elastic
                name: elasticsearch-es-elastic-user
          - name: MONITORING_ES_USERNAME
            value: elastic
          - name: MONITORING_ES_PASSWORD
            valueFrom:
              secretKeyRef:
                key: elastic
                name: elasticsearch-monitoring-es-elastic-user
---
apiVersion: rbac.authorization.k8s.io/v1
kind: ClusterRole
metadata:
  name: metricbeat
rules:
- apiGroups: [""] # "" indicates the core API group
  resources:
  - namespaces
  - pods
  - nodes
  verbs:
  - get
  - watch
  - list
---
apiVersion: v1
kind: ServiceAccount
metadata:
  name: metricbeat
  namespace: default
---
apiVersion: rbac.authorization.k8s.io/v1
kind: ClusterRoleBinding
metadata:
  name: metricbeat
subjects:
- kind: ServiceAccount
  name: metricbeat
  namespace: default
roleRef:
  kind: ClusterRole
  name: metricbeat
  apiGroup: rbac.authorization.k8s.io
Please note that the elasticsearchRef is now removed and I have added the output.elasticsearch section
$ kubectl apply -f metricbeat.yaml
beat.beat.k8s.elastic.co/metricbeat created
clusterrole.rbac.authorization.k8s.io/metricbeat created
serviceaccount/metricbeat created
clusterrolebinding.rbac.authorization.k8s.io/metricbeat created
$ kubectl port-forward service/kibana-monitoring-kb-http 5601 13:44:33
Forwarding from 127.0.0.1:5601 -> 5601
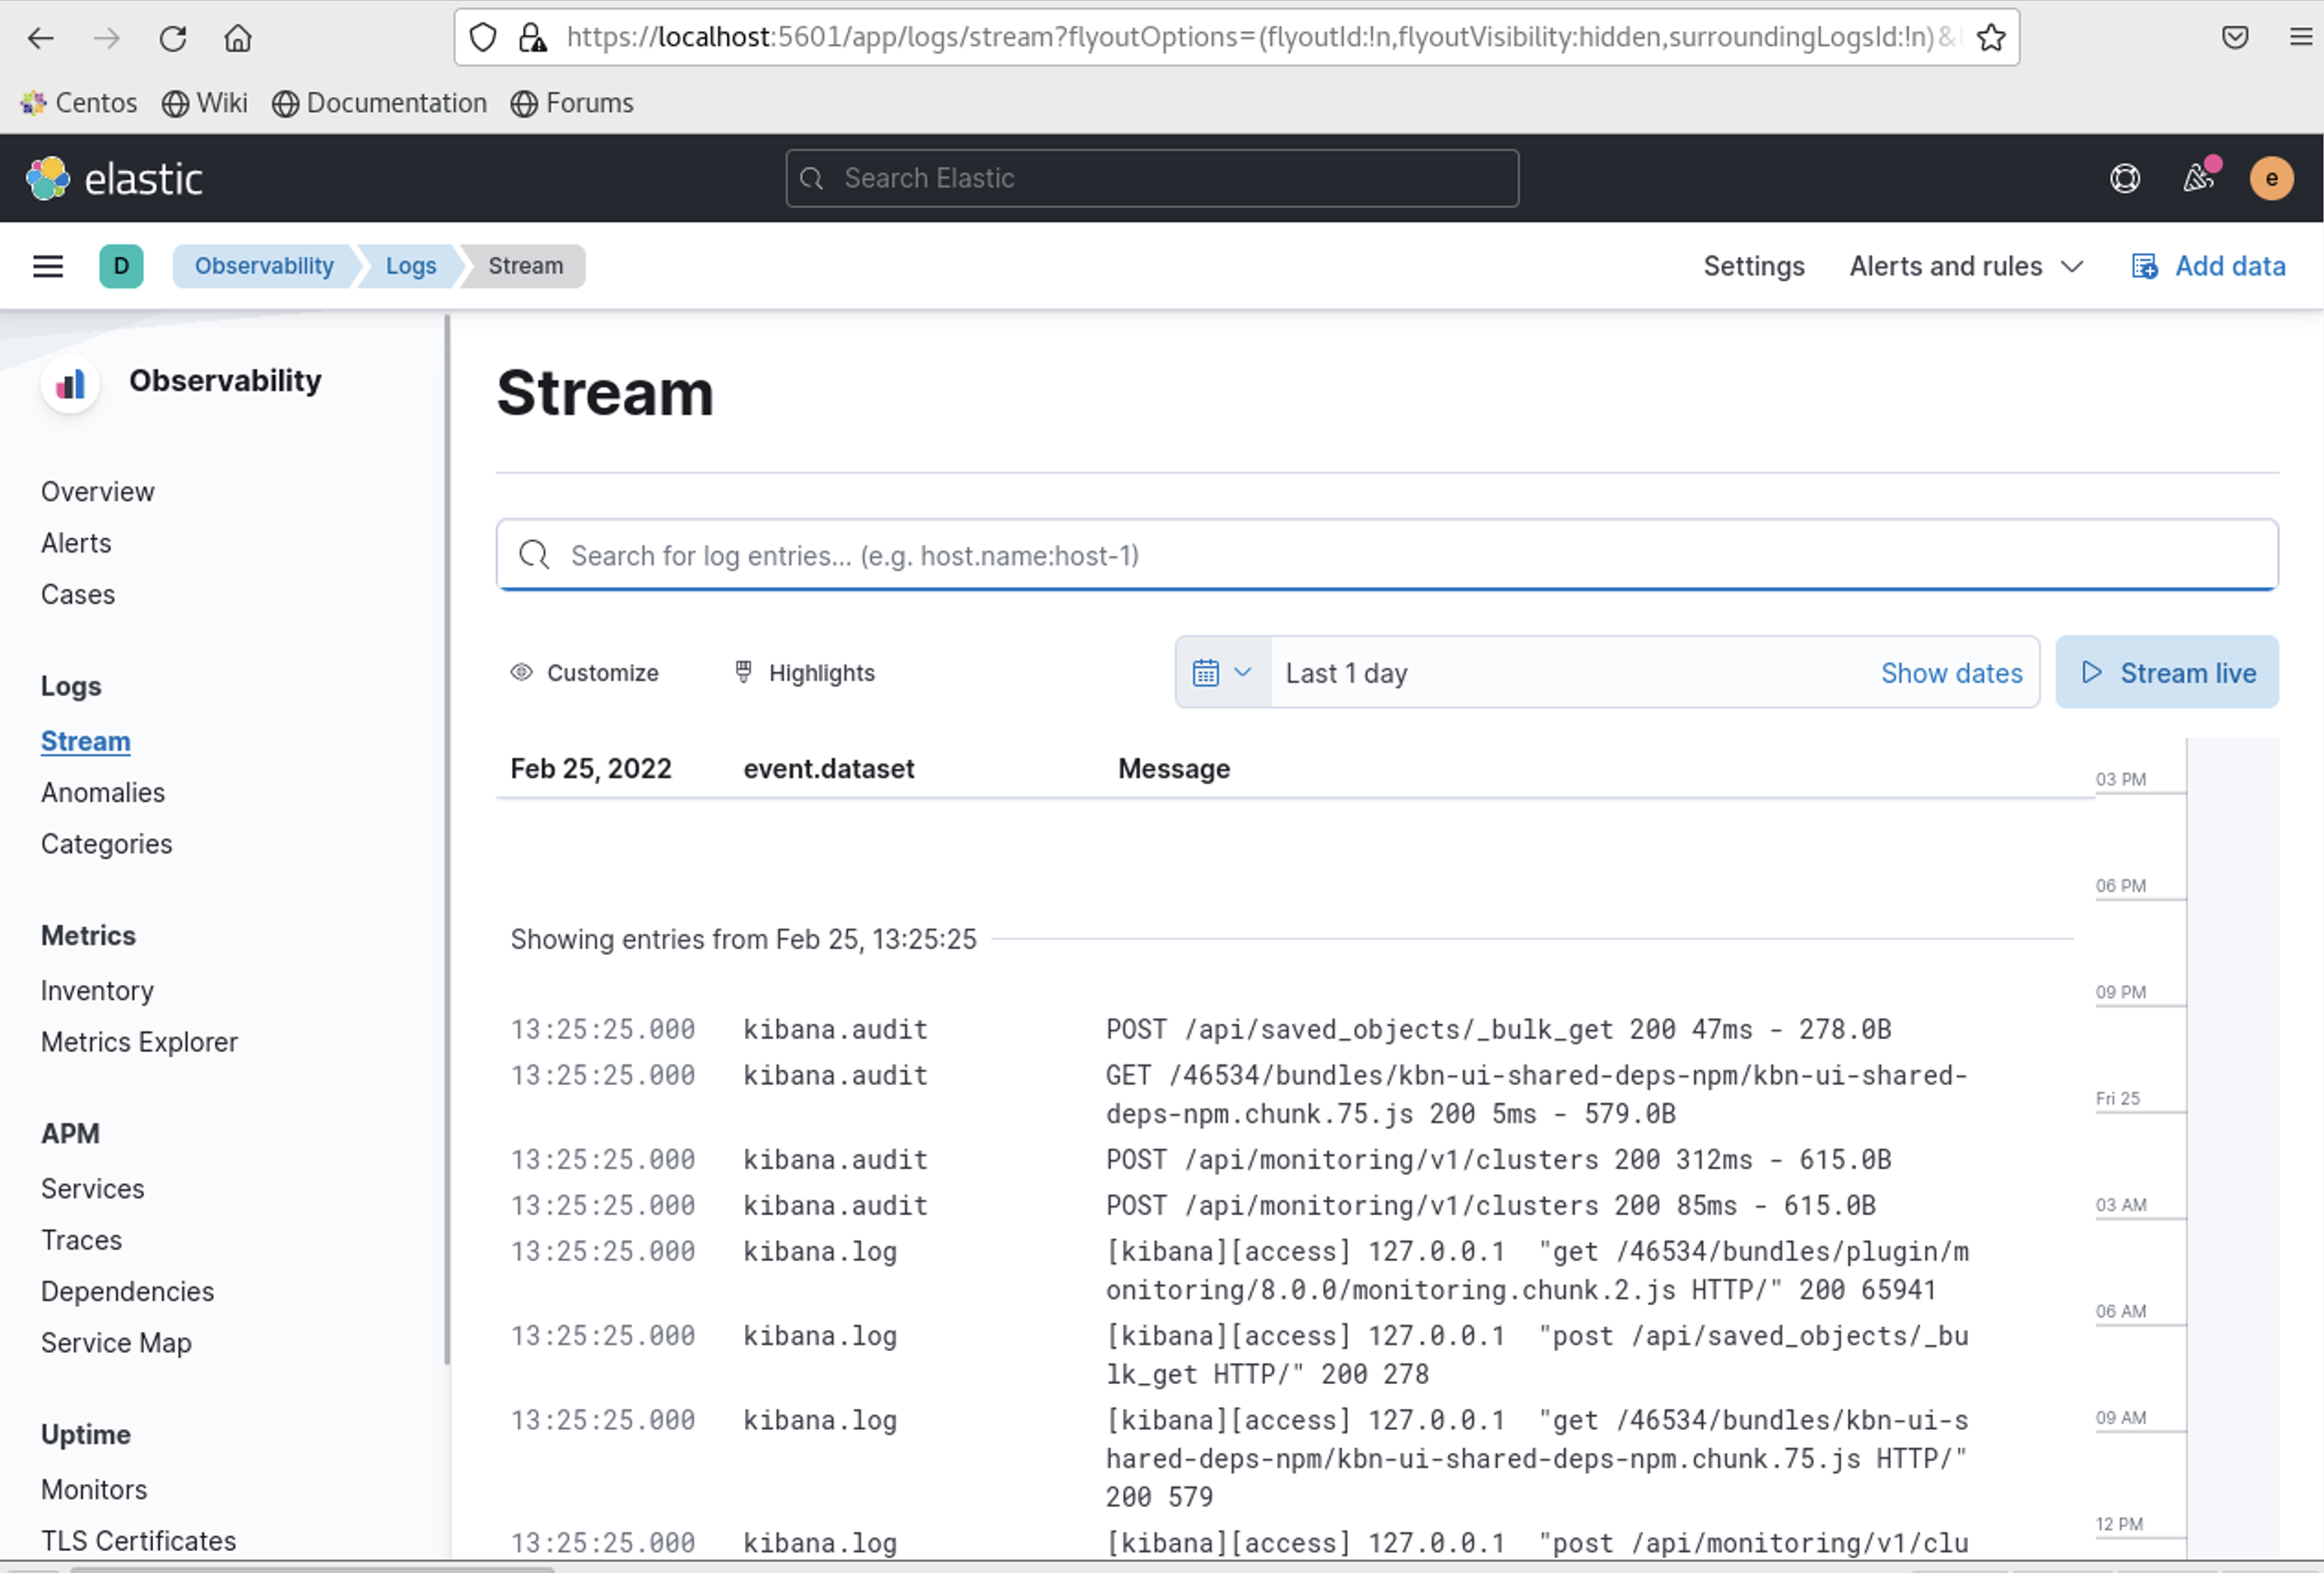
Forwarding from [::1]:5601 -> 5601Log into your kibana on the monitoring side and now you will see that you have stack monitoring with metrics.
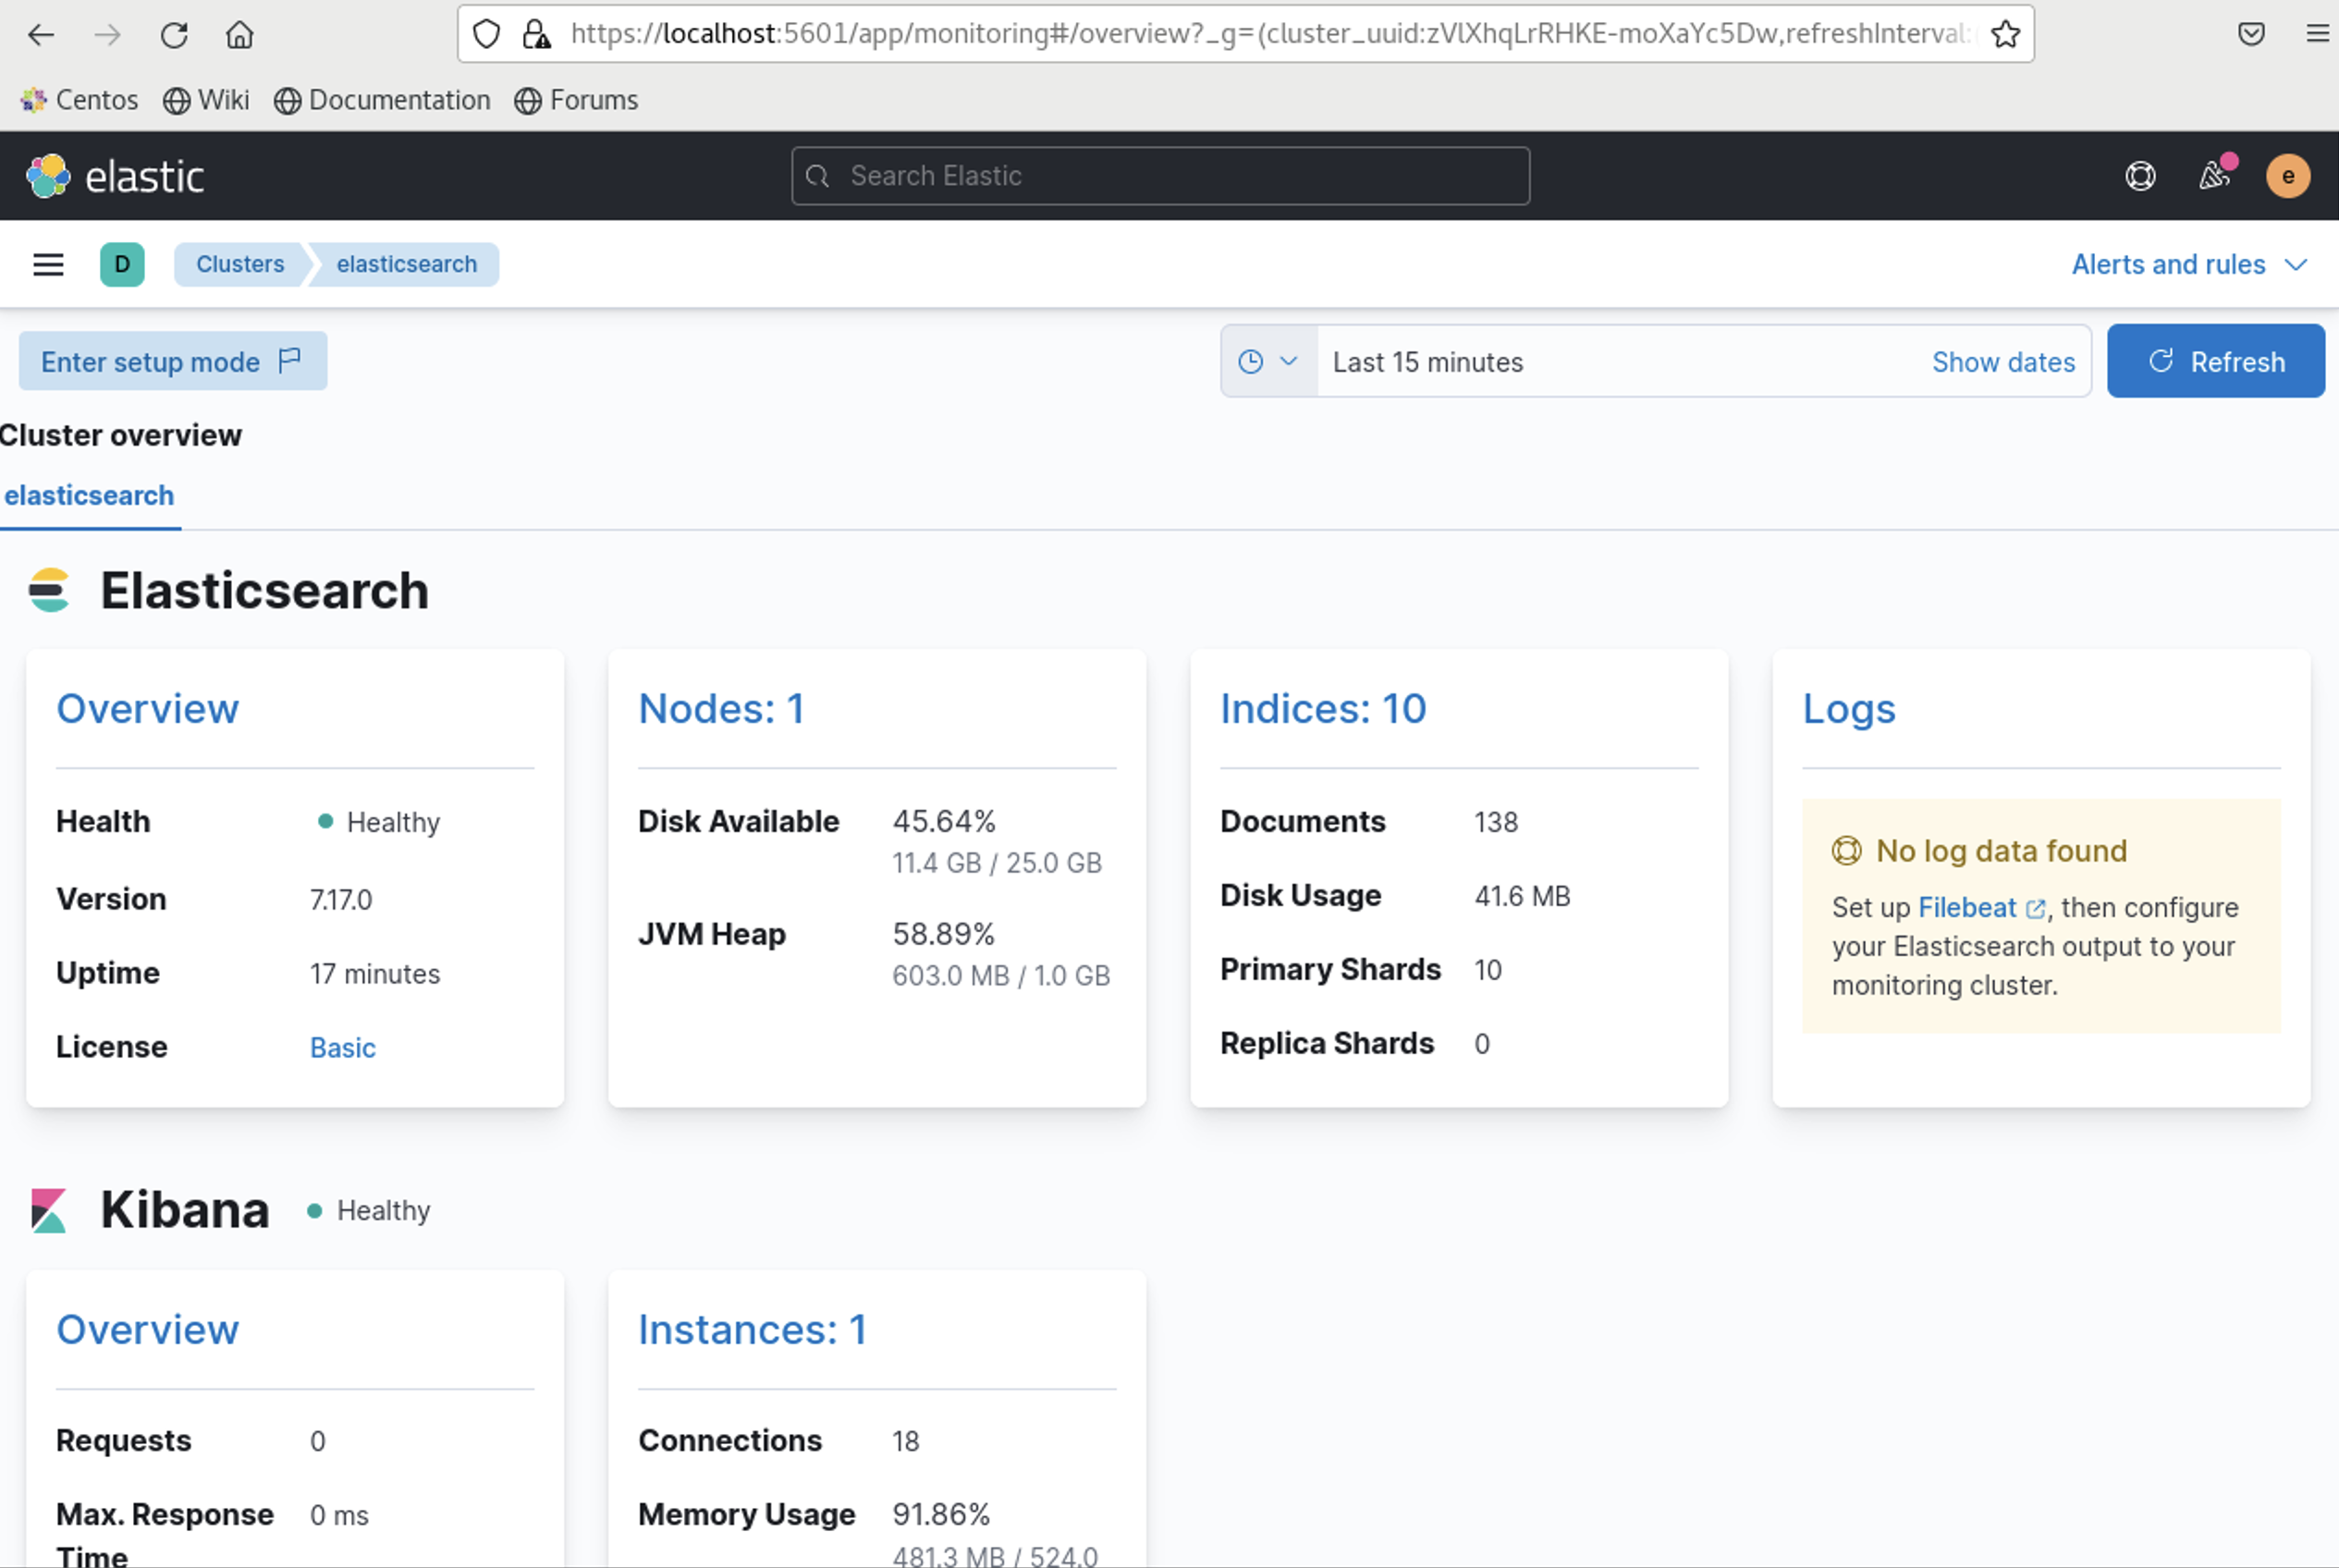
You will see that the logs are missing so lets get to work
- filebeat and its crds
---
# filebeat resources
apiVersion: beat.k8s.elastic.co/v1beta1
kind: Beat
metadata:
  name: filebeat
spec:
  type: filebeat
  version: 7.17.0
  config:
    filebeat:
      autodiscover:
        providers:
        - type: kubernetes
          node: ${NODE_NAME}
          hints:
            enabled: true
            default_config:
              type: container
              paths:
              - /var/log/containers/*${data.kubernetes.container.id}.log
    processors:
    - add_cloud_metadata: {}
    - add_host_metadata: {}
    logging.json: true
    setup.kibana:
      host: "https://kibana-monitoring-kb-http:5601"
      username: ${MONITORING_ES_USERNAME}
      password: ${MONITORING_ES_PASSWORD}
      ssl:
        verification_mode: none
    output.elasticsearch:
      hosts: [ "https://elasticsearch-monitoring-es-http:9200" ]
      username: ${MONITORING_ES_USERNAME}
      password: ${MONITORING_ES_PASSWORD}
      ssl:
        verification_mode: none
  daemonSet:
    podTemplate:
      spec:
        serviceAccountName: filebeat
        automountServiceAccountToken: true
        terminationGracePeriodSeconds: 30
        dnsPolicy: ClusterFirstWithHostNet
        hostNetwork: true # Allows to provide richer host metadata
        securityContext:
          runAsUser: 0
          # If using Red Hat OpenShift uncomment this:
          #privileged: true
        containers:
        - name: filebeat
          volumeMounts:
          - name: varlogcontainers
            mountPath: /var/log/containers
          - name: varlogpods
            mountPath: /var/log/pods
          - name: varlibdockercontainers
            mountPath: /var/lib/docker/containers
          env:
            - name: NODE_NAME
              valueFrom:
                fieldRef:
                  fieldPath: spec.nodeName
            - name: MONITORING_ES_USERNAME
              value: elastic
            - name: MONITORING_ES_PASSWORD
              valueFrom:
                secretKeyRef:
                  key: elastic
                  name: elasticsearch-monitoring-es-elastic-user
        volumes:
        - name: varlogcontainers
          hostPath:
            path: /var/log/containers
        - name: varlogpods
          hostPath:
            path: /var/log/pods
        - name: varlibdockercontainers
          hostPath:
            path: /var/lib/docker/containers
---
apiVersion: rbac.authorization.k8s.io/v1
kind: ClusterRole
metadata:
  name: filebeat
rules:
- apiGroups: [""] # "" indicates the core API group
  resources:
  - namespaces
  - pods
  - nodes
  verbs:
  - get
  - watch
  - list
---
apiVersion: v1
kind: ServiceAccount
metadata:
  name: filebeat
  namespace: default
---
apiVersion: rbac.authorization.k8s.io/v1
kind: ClusterRoleBinding
metadata:
  name: filebeat
subjects:
- kind: ServiceAccount
  name: filebeat
  namespace: default
roleRef:
  kind: ClusterRole
  name: filebeat
  apiGroup: rbac.authorization.k8s.io
On this one we’ve removed both elasticsearchRef & kibanaRef and added our setup.kibana & output.elasticsearch separately
Stack monitoring sending data to external cluster
On the last example we will ship our monitoring data from the production cluster onto a monitoring cluster that is in the elastic cloud
We will follow the same example from the above and deploy our production deployment
For our cloud deployment we will use the following
es https://266dfc3afbb24debbdd8379ce22647bb.us-central1.gcp.cloud.es.io:9243
kb https://78943fd28c834bfb9ff4a4cf5f1f445c.us-central1.gcp.cloud.es.io:9243
testuser/testpassword
Lets make changes to our metricbeat.yaml & filebeat.yaml
metricbeat.yaml
---
# metricbeat resources
apiVersion: beat.k8s.elastic.co/v1beta1
kind: Beat
metadata:
  name: metricbeat
spec:
  type: metricbeat
  version: 7.17.0
  config:
    metricbeat:
      autodiscover:
        providers:
          - type: kubernetes
            scope: cluster
            hints.enabled: true
            templates:
              - condition:
                  contains:
                    kubernetes.labels.scrape: es
                config:
                  - module: elasticsearch
                    metricsets:
                      - ccr
                      - cluster_stats
                      - enrich
                      - index
                      - index_recovery
                      - index_summary
                      - ml_job
                      - node_stats
                      - shard
                    period: 10s
                    hosts: "https://${data.host}:${data.ports.https}"
                    username: ${MONITORED_ES_USERNAME}
                    password: ${MONITORED_ES_PASSWORD}
                    # WARNING: disables TLS as the default certificate is not valid for the pod FQDN
                    # TODO: switch this to "certificate" when available: https://github.com/elastic/beats/issues/8164
                    ssl.verification_mode: "none"
                    xpack.enabled: true
              - condition:
                  contains:
                    kubernetes.labels.scrape: kb
                config:
                  - module: kibana
                    metricsets:
                      - stats
                    period: 10s
                    hosts: "https://${data.host}:${data.ports.https}"
                    username: ${MONITORED_ES_USERNAME}
                    password: ${MONITORED_ES_PASSWORD}
                    # WARNING: disables TLS as the default certificate is not valid for the pod FQDN
                    # TODO: switch this to "certificate" when available: https://github.com/elastic/beats/issues/8164
                    ssl.verification_mode: "none"
                    xpack.enabled: true
    processors:
    - add_cloud_metadata: {}
    logging.json: true
    output.elasticsearch:
      hosts: [ "https://266dfc3afbb24debbdd8379ce22647bb.us-central1.gcp.cloud.es.io:9243" ]
      username: ${MONITORING_ES_USERNAME}
      password: ${MONITORING_ES_PASSWORD}
      ssl:
        verification_mode: none
  deployment:
    podTemplate:
      spec:
        serviceAccountName: metricbeat
        automountServiceAccountToken: true
        # required to read /etc/beat.yml
        securityContext:
          runAsUser: 0
        containers:
        - name: metricbeat
          env:
          - name: MONITORED_ES_USERNAME
            value: elastic
          - name: MONITORED_ES_PASSWORD
            valueFrom:
              secretKeyRef:
                key: elastic
                name: elasticsearch-es-elastic-user
          - name: MONITORING_ES_USERNAME
            value: testuser
          - name: MONITORING_ES_PASSWORD
            value: testpassword
---
apiVersion: rbac.authorization.k8s.io/v1
kind: ClusterRole
metadata:
  name: metricbeat
rules:
- apiGroups: [""] # "" indicates the core API group
  resources:
  - namespaces
  - pods
  - nodes
  verbs:
  - get
  - watch
  - list
---
apiVersion: v1
kind: ServiceAccount
metadata:
  name: metricbeat
  namespace: default
---
apiVersion: rbac.authorization.k8s.io/v1
kind: ClusterRoleBinding
metadata:
  name: metricbeat
subjects:
- kind: ServiceAccount
  name: metricbeat
  namespace: default
roleRef:
  kind: ClusterRole
  name: metricbeat
  apiGroup: rbac.authorization.k8s.io
filebeat.yaml
---
# filebeat resources
apiVersion: beat.k8s.elastic.co/v1beta1
kind: Beat
metadata:
name: filebeat
spec:
type: filebeat
version: 7.17.0
config:
filebeat:
autodiscover:
providers:
- type: kubernetes
node: ${NODE_NAME}
hints:
enabled: true
default_config:
type: container
paths:
- /var/log/containers/*${data.kubernetes.container.id}.log
processors:
- add_cloud_metadata: {}
- add_host_metadata: {}
logging.json: true
setup.kibana:
host: "https://78943fd28c834bfb9ff4a4cf5f1f445c.us-central1.gcp.cloud.es.io:9243"
username: ${MONITORING_ES_USERNAME}
password: ${MONITORING_ES_PASSWORD}
ssl:
verification_mode: none
output.elasticsearch:
hosts: [ "https://266dfc3afbb24debbdd8379ce22647bb.us-central1.gcp.cloud.es.io:9243" ]
username: ${MONITORING_ES_USERNAME}
password: ${MONITORING_ES_PASSWORD}
ssl:
verification_mode: none
daemonSet:
podTemplate:
spec:
serviceAccountName: filebeat
automountServiceAccountToken: true
terminationGracePeriodSeconds: 30
dnsPolicy: ClusterFirstWithHostNet
hostNetwork: true # Allows to provide richer host metadata
securityContext:
runAsUser: 0
# If using Red Hat OpenShift uncomment this:
#privileged: true
containers:
- name: filebeat
volumeMounts:
- name: varlogcontainers
mountPath: /var/log/containers
- name: varlogpods
mountPath: /var/log/pods
- name: varlibdockercontainers
mountPath: /var/lib/docker/containers
env:
- name: NODE_NAME
valueFrom:
fieldRef:
fieldPath: spec.nodeName
- name: MONITORING_ES_USERNAME
value: testuser
- name: MONITORING_ES_PASSWORD
value: testpassword
volumes:
- name: varlogcontainers
hostPath:
path: /var/log/containers
- name: varlogpods
hostPath:
path: /var/log/pods
- name: varlibdockercontainers
hostPath:
path: /var/lib/docker/containers
---
apiVersion: rbac.authorization.k8s.io/v1
kind: ClusterRole
metadata:
name: filebeat
rules:
- apiGroups: [""] # "" indicates the core API group
resources:
- namespaces
- pods
- nodes
verbs:
- get
- watch
- list
---
apiVersion: v1
kind: ServiceAccount
metadata:
name: filebeat
namespace: default
---
apiVersion: rbac.authorization.k8s.io/v1
kind: ClusterRoleBinding
metadata:
name: filebeat
subjects:
- kind: ServiceAccount
name: filebeat
namespace: default
roleRef:
kind: ClusterRole
name: filebeat
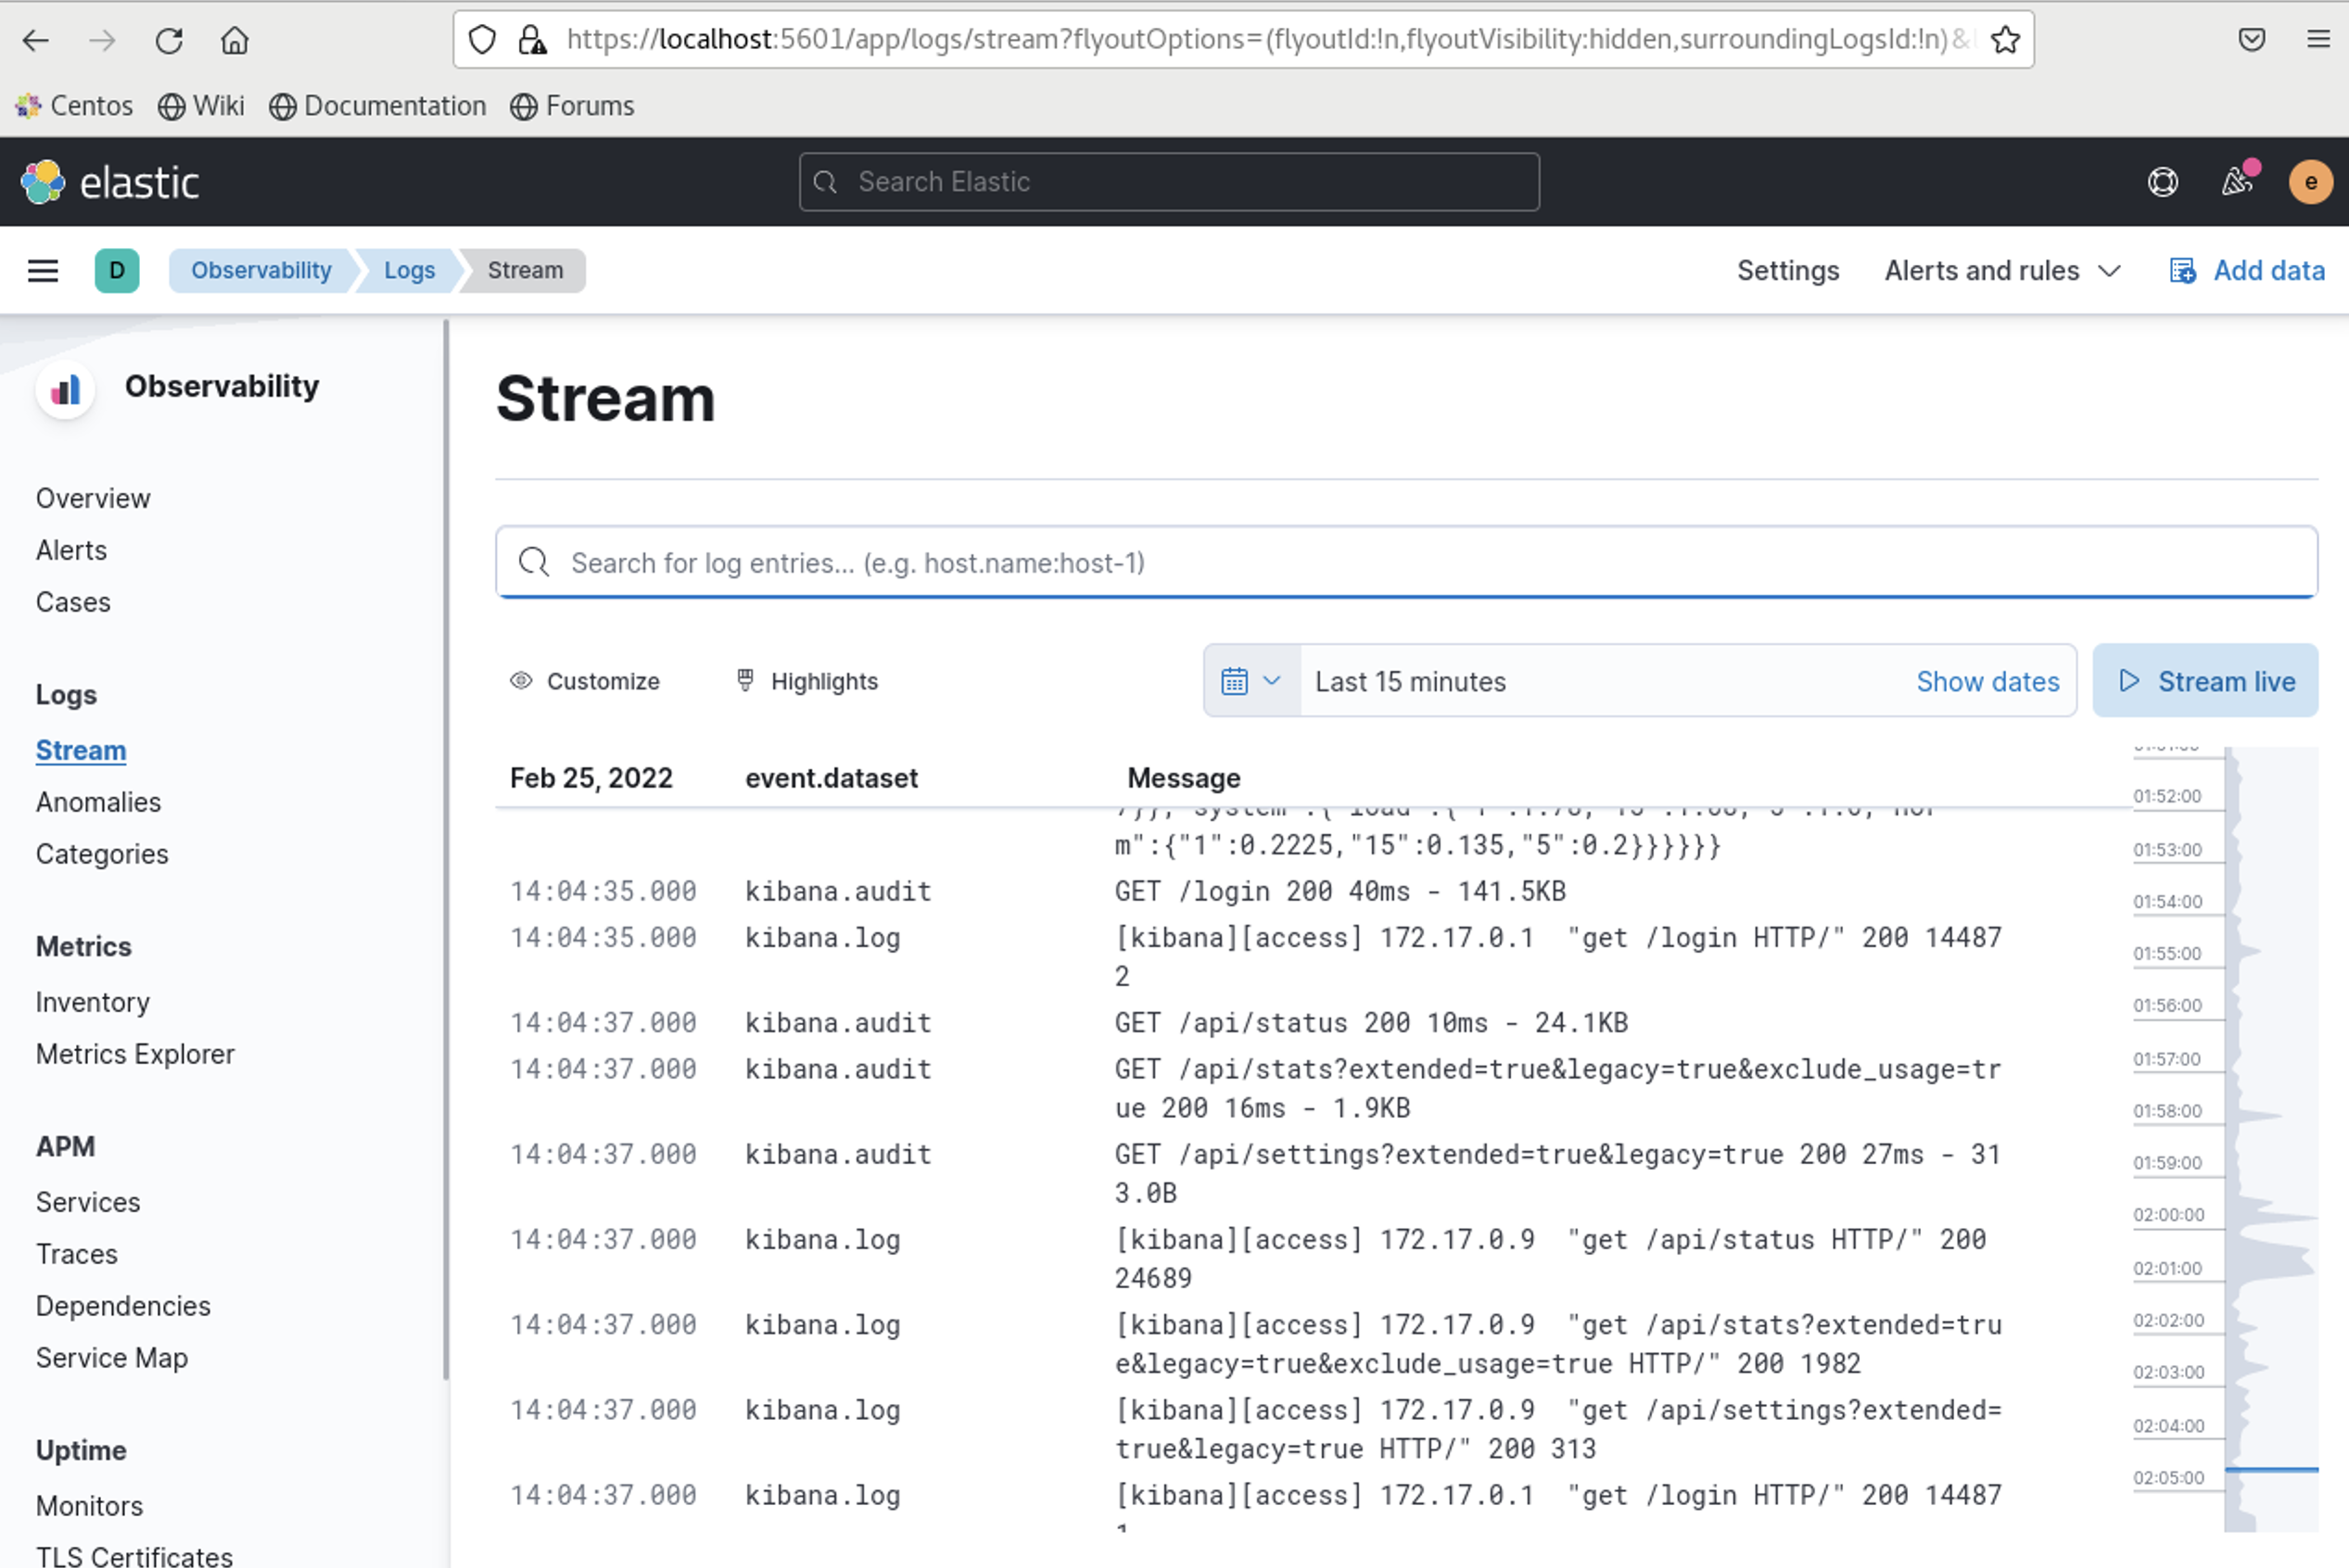
apiGroup: rbac.authorization.k8s.ioand now we have data!
All good here! but wait I dont want to expose the endpoint/username/password for my monitoring cluster!
Lets configure secrets and do this via secrets.
Create mon.yaml with my secret details
apiVersion: v1
kind: Secret
metadata:
  name: monitoring-cluster
  namespace: default
type: Opaque
stringData:
  username: "testuser"
  password: "testpassword"
  esendpoint: "https://266dfc3afbb24debbdd8379ce22647bb.us-central1.gcp.cloud.es.io:9243"
  kbendpoint: "https://78943fd28c834bfb9ff4a4cf5f1f445c.us-central1.gcp.cloud.es.io:9243"
kubectl apply -f mon.yamlLets see if our secret got created
$ kubectl get secrets | grep monitoring-cluster
monitoring-cluster                            Opaque                                4      2m34s

$ kubectl describe secrets monitoring-cluster

Name:         monitoring-cluster
Namespace:    default
Labels:       <none>
Annotations:  <none>

Type:  Opaque

Data
====
esendpoint:  73 bytes
kbendpoint:  73 bytes
password:    12 bytes
username:    8 bytes

$ kubectl get secrets monitoring-cluster -o go-template='{{.data.username | base64decode}}'
testuser

$ kubectl get secrets monitoring-cluster -o go-template='{{.data.password | base64decode}}'
testpassword

$ kubectl get secrets monitoring-cluster -o go-template='{{.data.esendpoint | base64decode}}'
https://266dfc3afbb24debbdd8379ce22647bb.us-central1.gcp.cloud.es.io:9243

$ kubectl get secrets monitoring-cluster -o go-template='{{.data.kbendpoint | base64decode}}'
https://78943fd28c834bfb9ff4a4cf5f1f445c.us-central1.gcp.cloud.es.io:9243%
for our metricbeat.yml lets edit
    output.elasticsearch:
      hosts: [ "https://266dfc3afbb24debbdd8379ce22647bb.us-central1.gcp.cloud.es.io:9243" ]
      username: ${MONITORING_ES_USERNAME}
      password: ${MONITORING_ES_PASSWORD}
      ssl:
        verification_mode: none
  deployment:
    podTemplate:
      spec:
        serviceAccountName: metricbeat
        automountServiceAccountToken: true
        # required to read /etc/beat.yml
        securityContext:
          runAsUser: 0
        containers:
        - name: metricbeat
          env:
          - name: MONITORED_ES_USERNAME
            value: elastic
          - name: MONITORED_ES_PASSWORD
            valueFrom:
              secretKeyRef:
                key: elastic
                name: elasticsearch-es-elastic-user
          - name: MONITORING_ES_USERNAME
            value: testuser
          - name: MONITORING_ES_PASSWORD
            value: testpassword
INTO
    output.elasticsearch:
      hosts: [ "${MONITORING_ES_ENDPOINT}" ]
      username: ${MONITORING_ES_USERNAME}
      password: ${MONITORING_ES_PASSWORD}
      ssl:
        verification_mode: none
  deployment:
    podTemplate:
      spec:
        serviceAccountName: metricbeat
        automountServiceAccountToken: true
        # required to read /etc/beat.yml
        securityContext:
          runAsUser: 0
        containers:
        - name: metricbeat
          env:
          - name: MONITORED_ES_USERNAME
            value: elastic
          - name: MONITORED_ES_PASSWORD
            valueFrom:
              secretKeyRef:
                key: elastic
                name: elasticsearch-es-elastic-user
          - name: MONITORING_ES_USERNAME
            valueFrom:
              secretKeyRef:
                key: username
                name: monitoring-cluster
          - name: MONITORING_ES_PASSWORD
            valueFrom:
              secretKeyRef:
                key: password
                name: monitoring-cluster
          - name: MONITORING_ES_ENDPOINT
            valueFrom:
              secretKeyRef:
                name: esendpoint
                name: monitoring-cluster
For filebeat.yaml
    setup.kibana:
      host: "https://78943fd28c834bfb9ff4a4cf5f1f445c.us-central1.gcp.cloud.es.io:9243"
      username: ${MONITORING_ES_USERNAME}
      password: ${MONITORING_ES_PASSWORD}
      ssl:
        verification_mode: none
    output.elasticsearch:
      hosts: [ "https://266dfc3afbb24debbdd8379ce22647bb.us-central1.gcp.cloud.es.io:9243" ]
      username: ${MONITORING_ES_USERNAME}
      password: ${MONITORING_ES_PASSWORD}
      ssl:
        verification_mode: none
  daemonSet:
    podTemplate:
      spec:
        serviceAccountName: filebeat
        automountServiceAccountToken: true
        terminationGracePeriodSeconds: 30
        dnsPolicy: ClusterFirstWithHostNet
        hostNetwork: true # Allows to provide richer host metadata
        securityContext:
          runAsUser: 0
          # If using Red Hat OpenShift uncomment this:
          #privileged: true
        containers:
        - name: filebeat
          volumeMounts:
          - name: varlogcontainers
            mountPath: /var/log/containers
          - name: varlogpods
            mountPath: /var/log/pods
          - name: varlibdockercontainers
            mountPath: /var/lib/docker/containers
          env:
            - name: NODE_NAME
              valueFrom:
                fieldRef:
                  fieldPath: spec.nodeName
            - name: MONITORING_ES_USERNAME
              value: testuser
            - name: MONITORING_ES_PASSWORD
              value: testpassword
INTO
    setup.kibana:
      host: ${MONITORING_KB_ENDPOINT}
      username: ${MONITORING_ES_USERNAME}
      password: ${MONITORING_ES_PASSWORD}
      ssl:
        verification_mode: none
    output.elasticsearch:
      hosts: [ ${MONITORING_ES_ENDPOINT} ]
      username: ${MONITORING_ES_USERNAME}
      password: ${MONITORING_ES_PASSWORD}
      ssl:
        verification_mode: none
  daemonSet:
    podTemplate:
      spec:
        serviceAccountName: filebeat
        automountServiceAccountToken: true
        terminationGracePeriodSeconds: 30
        dnsPolicy: ClusterFirstWithHostNet
        hostNetwork: true # Allows to provide richer host metadata
        securityContext:
          runAsUser: 0
          # If using Red Hat OpenShift uncomment this:
          #privileged: true
        containers:
        - name: filebeat
          volumeMounts:
          - name: varlogcontainers
            mountPath: /var/log/containers
          - name: varlogpods
            mountPath: /var/log/pods
          - name: varlibdockercontainers
            mountPath: /var/lib/docker/containers
          env:
            - name: NODE_NAME
              valueFrom:
                fieldRef:
                  fieldPath: spec.nodeName
            - name: MONITORING_ES_USERNAME
              valueFrom:
                secretKeyRef:
                  key: username
                  name: monitoring-cluster
            - name: MONITORING_ES_PASSWORD
              valueFrom:
                secretKeyRef:
                  key: password
                  name: monitoring-cluster
            - name: MONITORING_ES_ENDPOINT
              valueFrom:
                secretKeyRef:
                  key: esendpoint
                  name: monitoring-cluster
            - name: MONITORING_KB_ENDPOINT
              valueFrom:
                secretKeyRef:
                  key: kbendpoint
                  name: monitoring-cluster
Stack monitoring using sidecar containers – only for ECK 1.7+
This method uses sidecar containers for elasticsearch and kibana pods to send monitoring data to your monitoring cluster. It does not offer alot of customization however the configuration is much easier and very simple.
spec:
  monitoring:
    metrics:
      elasticsearchRefs:
      - name: monitoring-cluster    # assuming monitoring ES cluster name is "monitoring-cluster"
        namespace: observability    # assuming monitoring ES cluster is in observability namespace
    logs:
      elasticsearchRefs:
      - name: monitoring-cluster    # assuming monitoring ES cluster name is "monitoring-cluster"
        namespace: observability    # assuming monitoring ES cluster is in observability namespace
All you have to do is add the above into your production stack and already have a monitoring cluster running in the same k8s cluster and it will spin up additional sidecar containers for filebeat and metricbeat to your ES and kibana pods
https://www.elastic.co/guide/en/cloud-on-k8s/1.7/k8s-stack-monitoring.html for reference.
Awesome write up Justin!
Hi Justin! Awesome article. I’m new to the Elastic Stack and this has helped me a lot in getting the monitoring cluster working.
I am wondering if you have additional files to get the metrics from other parts of the stack in the Stack Monitoring section, like Filebeat and Logstash?
I’m stuck looking for a good reference online and I can’t find one.