Common troubleshooting items for any fleet & elastic-agent issues can be found on https://www.elastic.co/guide/en/fleet/current/fleet-troubleshooting.html however there are a few items that I would like to add.
Whitespaces
When you start the elastic-agent on an endpoint and even if you have everything configured for your elastic-agent, the right policy, integrations, etc however no data is going into elasticsearch. The most common issue is that there is something wrong with your fleet settings. This can be edited from kibana -> fleet -> settings. Either your ES endpoint / Fleet server endpoint / Advanced YAML settings are wrong or there might even be a simple typo like a whitespaces for formatting error. Remember YAML is very finicky and it requires proper indention.
If everything is configured correctly in Fleet Settings but your beats are still trying to send data to localhost:9200 then re-edit your Fleet Settings and verify for any white spaces and/or indentations.
Certificate Issue
When you enroll your elastic-agent and is getting x509 certificate issue during enrollment you can add the --insecure flag to enable communication between your elastic-agent and fleet server to get the agent enrolled only, this does not configure your beats agents behind elastic-agent to communicate with elasticsearch with insecure mode. If you are using self signed certificates for your elasticsearch endpoint you will need to edit your Advanced YAML Settings in Fleet Settings to include the CA and even possibly add ssl.verification_mode: none. This is shown on Configuring FLEET to register elastic-agents section of https://www.gooksu.com/2021/09/fleet-server-with-elasticsearch-in-docker-container/
So to recap enrollment/install is different than beats communication back to elasticsearch
Diagnostics
You are being asked to run an elastic-agent diagnostics collect but you are running your elastic-agent in a container. How do you take the elastic-agent diagnostics collect ?
You can exec into the container and run the diagnostics then copy it back to your host for analysis.
~ > docker exec -it fleet /bin/bash
root@80b9b43ed23f:/usr/share/elastic-agent# ls
LICENSE.txt  NOTICE.txt  README.md  certificates  container-paths.yml  data  elastic-agent  elastic-agent.reference.yml  elastic-agent.yml  fleet.yml  state

root@80b9b43ed23f:/usr/share/elastic-agent# ./elastic-agent diagnostics collect
Created diagnostics archive "elastic-agent-diagnostics-2022-06-16T19-35-44Z-00.zip"
***** WARNING *****
Created archive may contain plain text credentials.
Ensure that files in archive are redacted before sharing.
*******************

root@80b9b43ed23f:/usr/share/elastic-agent# ls
LICENSE.txt  NOTICE.txt  README.md  certificates  container-paths.yml  data  elastic-agent  elastic-agent-diagnostics-2022-06-16T19-35-44Z-00.zip  elastic-agent.reference.yml  elastic-agent.yml  fleet.yml  state

root@80b9b43ed23f:/usr/share/elastic-agent# exit
exit

~ > docker cp fleet:/usr/share/elastic-agent/elastic-agent-diagnostics-2022-06-16T19-35-44Z-00.zip ./

~/z > unzip elastic-agent-diagnostics-2022-06-16T19-35-44Z-00.zip
Archive:  elastic-agent-diagnostics-2022-06-16T19-35-44Z-00.zip
   creating: meta/
  inflating: meta/elastic-agent-version.yaml
  inflating: meta/metricbeat-default.yaml
  inflating: meta/filebeat-default.yaml
  inflating: meta/fleet-server-default.yaml
  inflating: meta/filebeat_monitoring-default.yaml
  inflating: meta/metricbeat_monitoring-default.yaml
   creating: config/
  inflating: config/elastic-agent-local.yaml
  inflating: config/elastic-agent-policy.yaml
  inflating: config/metricbeat_default.yaml
  inflating: config/fleet_monitoring_default.yaml
  inflating: config/fleet-server_default.yaml
  inflating: config/filebeat_default.yaml
   creating: logs/
   creating: logs/default/
  inflating: logs/default/filebeat-20220616-1.ndjson
  inflating: logs/default/filebeat-20220616.ndjson
  inflating: logs/default/fleet-server-20220616-1.ndjson
  inflating: logs/default/fleet-server-20220616-2.ndjson
  inflating: logs/default/fleet-server-20220616-3.ndjson
  inflating: logs/default/fleet-server-20220616-4.ndjson
  inflating: logs/default/fleet-server-20220616-5.ndjson
  inflating: logs/default/fleet-server-20220616-6.ndjson
  inflating: logs/default/fleet-server-20220616-7.ndjson
  inflating: logs/default/fleet-server-20220616.ndjson
  inflating: logs/default/metricbeat-20220616-1.ndjson
  inflating: logs/default/metricbeat-20220616.ndjson
  inflating: logs/elastic-agent-20220616-1.ndjson
  inflating: logs/elastic-agent-20220616.ndjson

~/z > ls
config                                                logs
elastic-agent-diagnostics-2022-06-16T19-35-44Z-00.zip meta
Debug
How do you enable debug logging?
There are two parts.
- enabling debug logging for various beats that run behind elastic-agent.
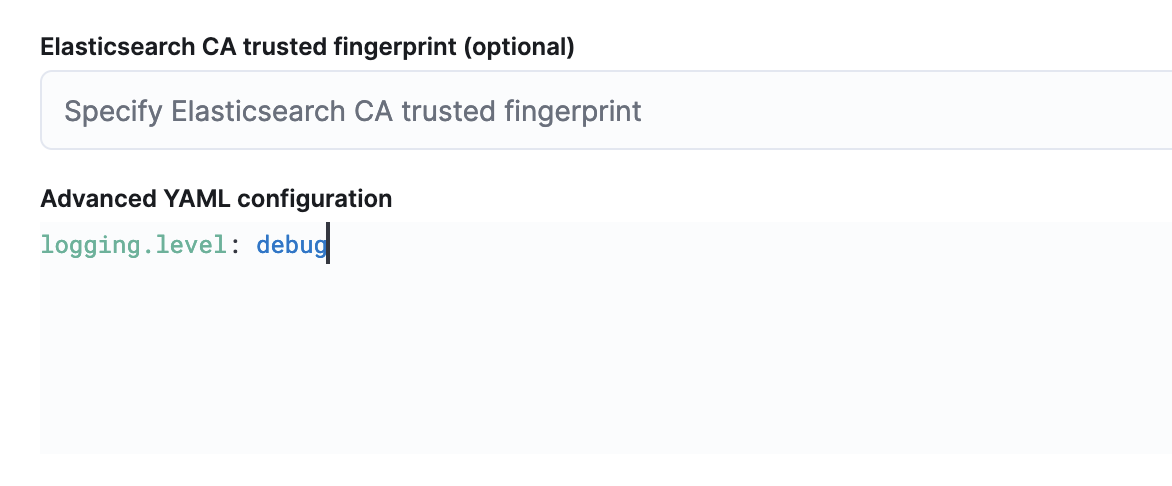
You can do this in your Fleet settings in the output that you are using by settinglogging.level: debugin the Advanced YAML configuration
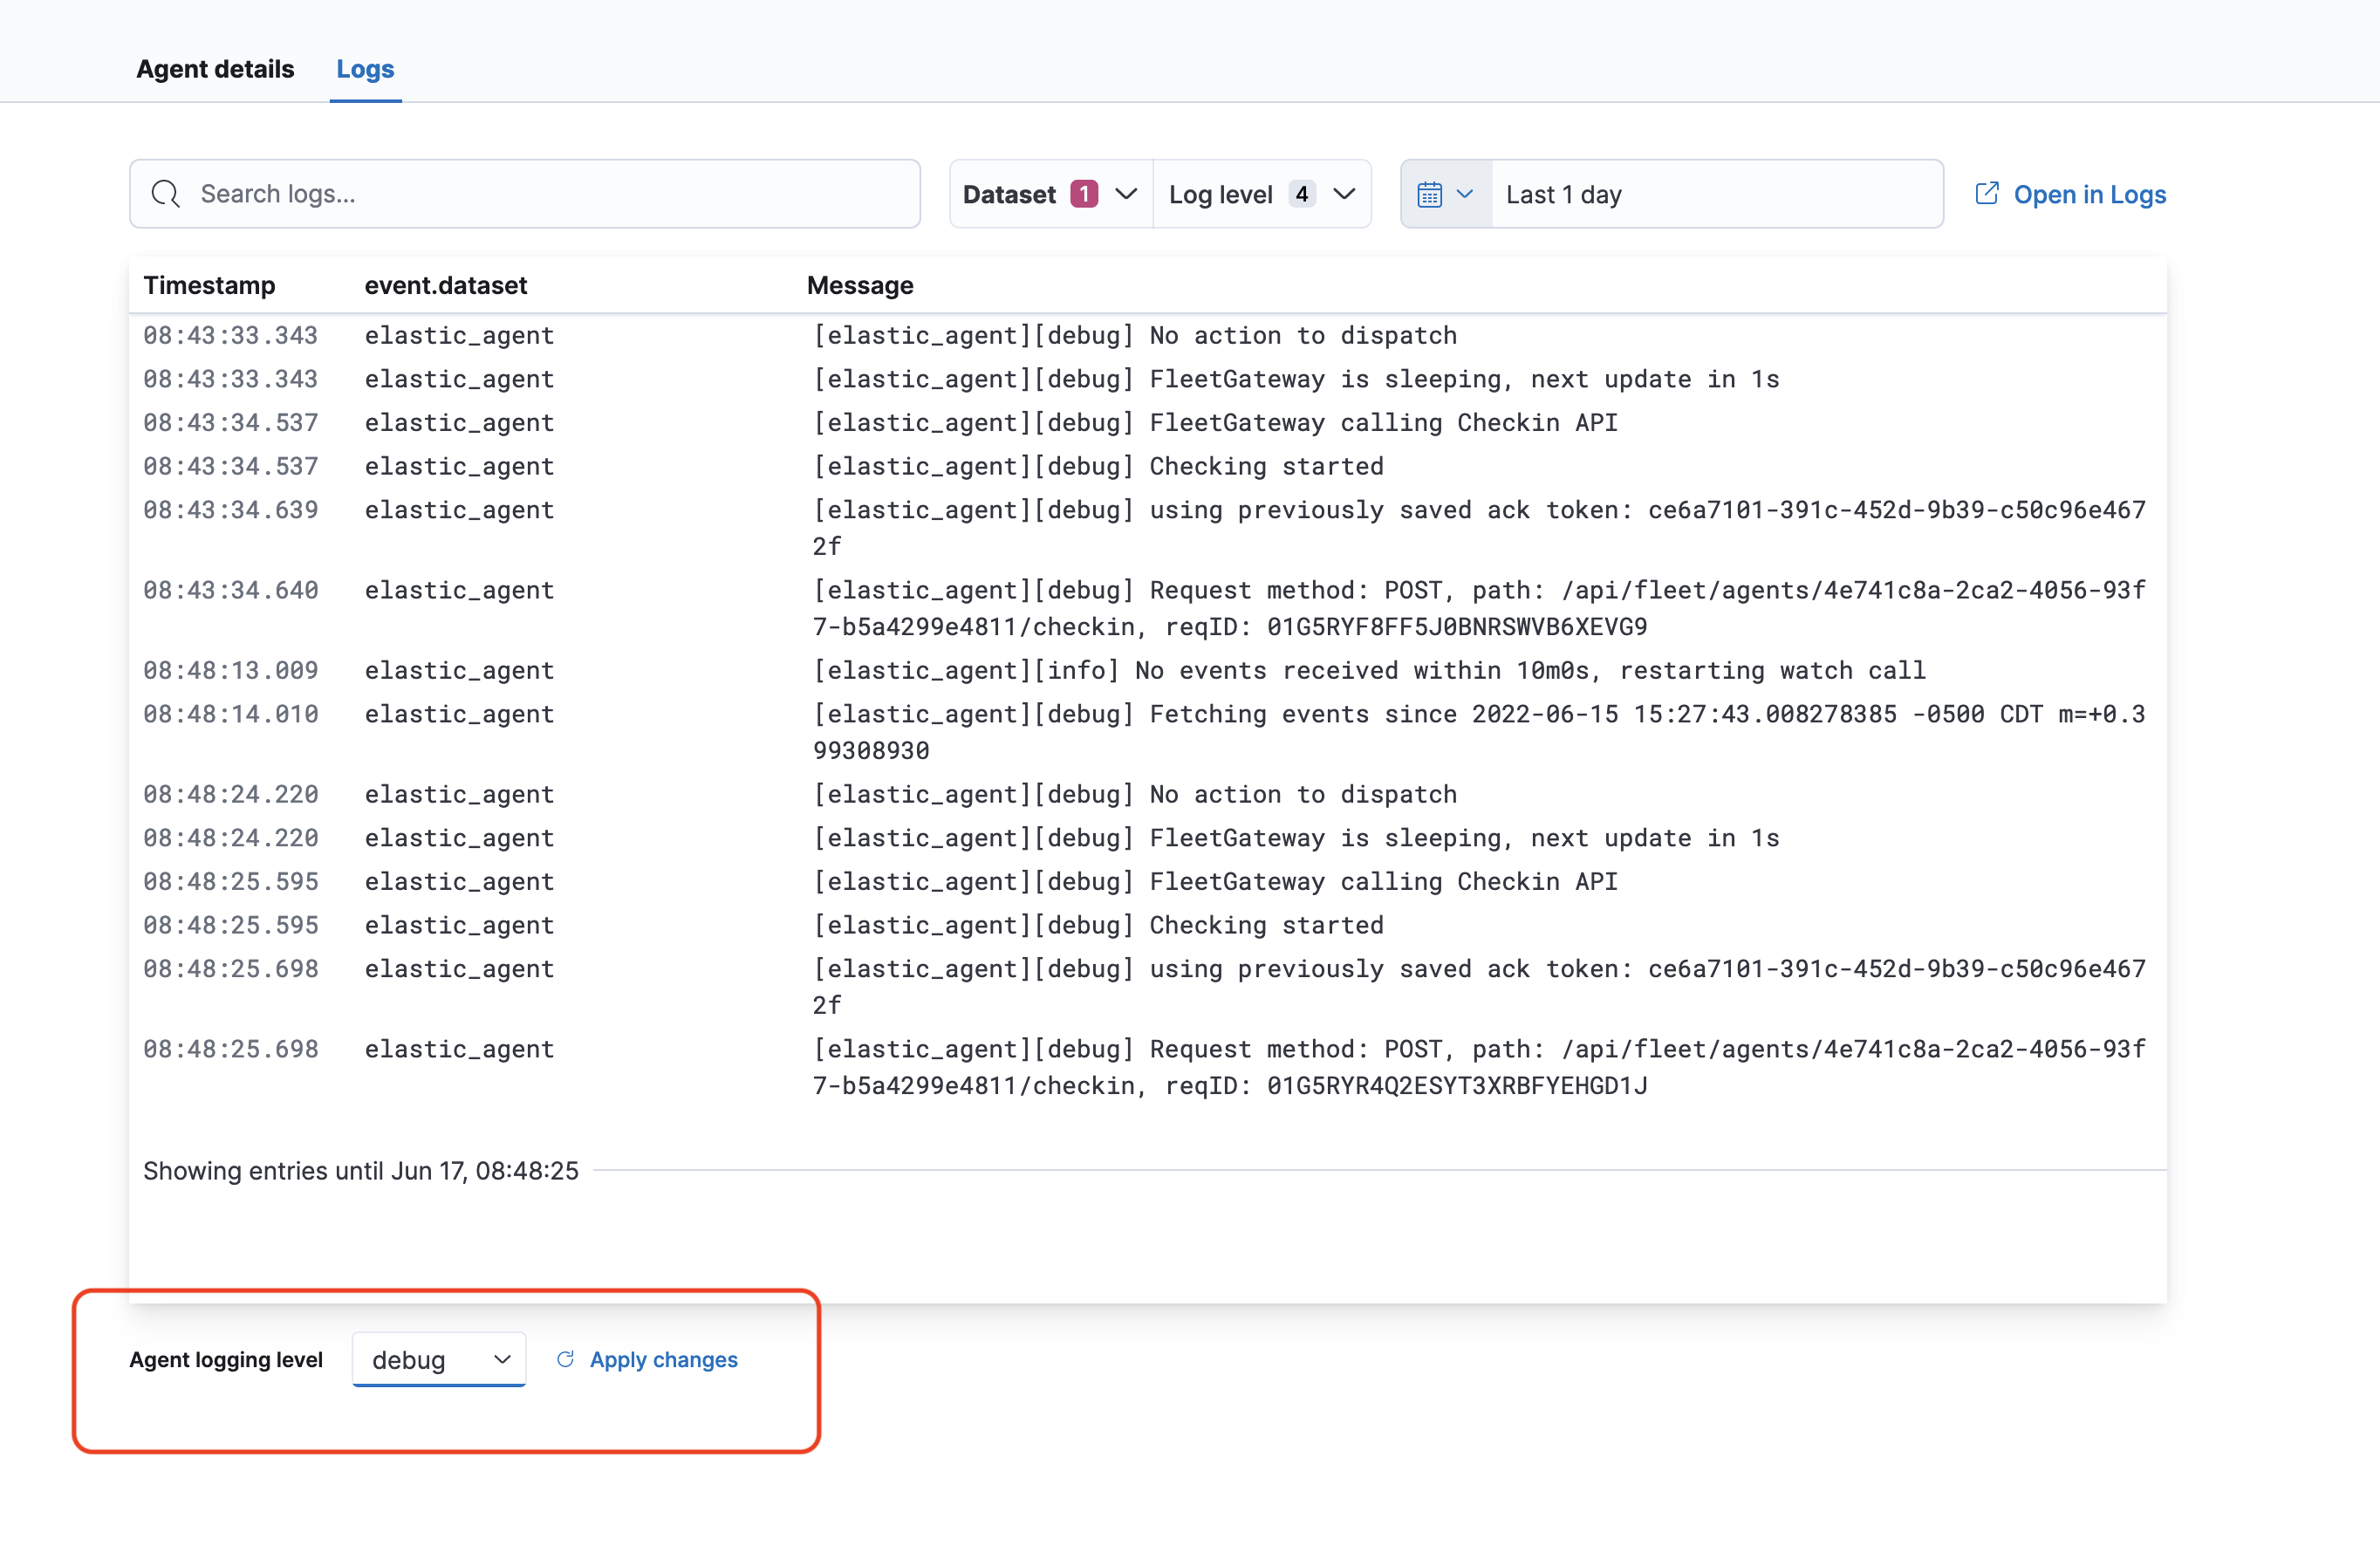
- enabling debug logging for elastic-agent. This will enable debug logs for the elastic-agent itself to troubleshoot issues with elastic-agent and the fleet server(or the fleet server itself).
This is done by clicking on each endpoint -> logs -> on the bottom change logs to debug then apply
State
state.yml shows correct output and settings but beats or endpoint agent is not updating its configuration to configure its settings to send to the ES cluster
- make sure that localhost resolves to 127.0.0.1, especially for endpoint agent if localhost is not mapped to 127.0.0.1 it elastic-agent will not be able to configure endpoint agent and elastic-agent itself will go into unhealthy state.
Unfortunately state.yml and other files are now encrypted and the files now end in .enc extenion which means that they are encrypted. The files were encrypted to hide sensitive information. In order to view the configurations in those files you will need to collect an elastic-agent diagnostics collect and unzip the diagnostics and view the files in the config directory now.
Performance troubleshooting
When you have a heavy ingest or ALOT of agents reporting in and is troubleshooting performance, it is good to ensure that the policy that your elastic-agent is bootstrapped to has logs & metrics enabled in the policy.
Where are the data stored?
Elasticsearch & Logstash
For elasticsearch/logstash you should enable a monitoring cluster and monitor it using metricbeats. This will export the metrics, ingest, load, memory usage, logstash pipeline(if used) onto the monitoring cluster so that you can view bottlenecks and trends. This data can be viewed on the monitoring cluster -> kibana -> Stack monitoring
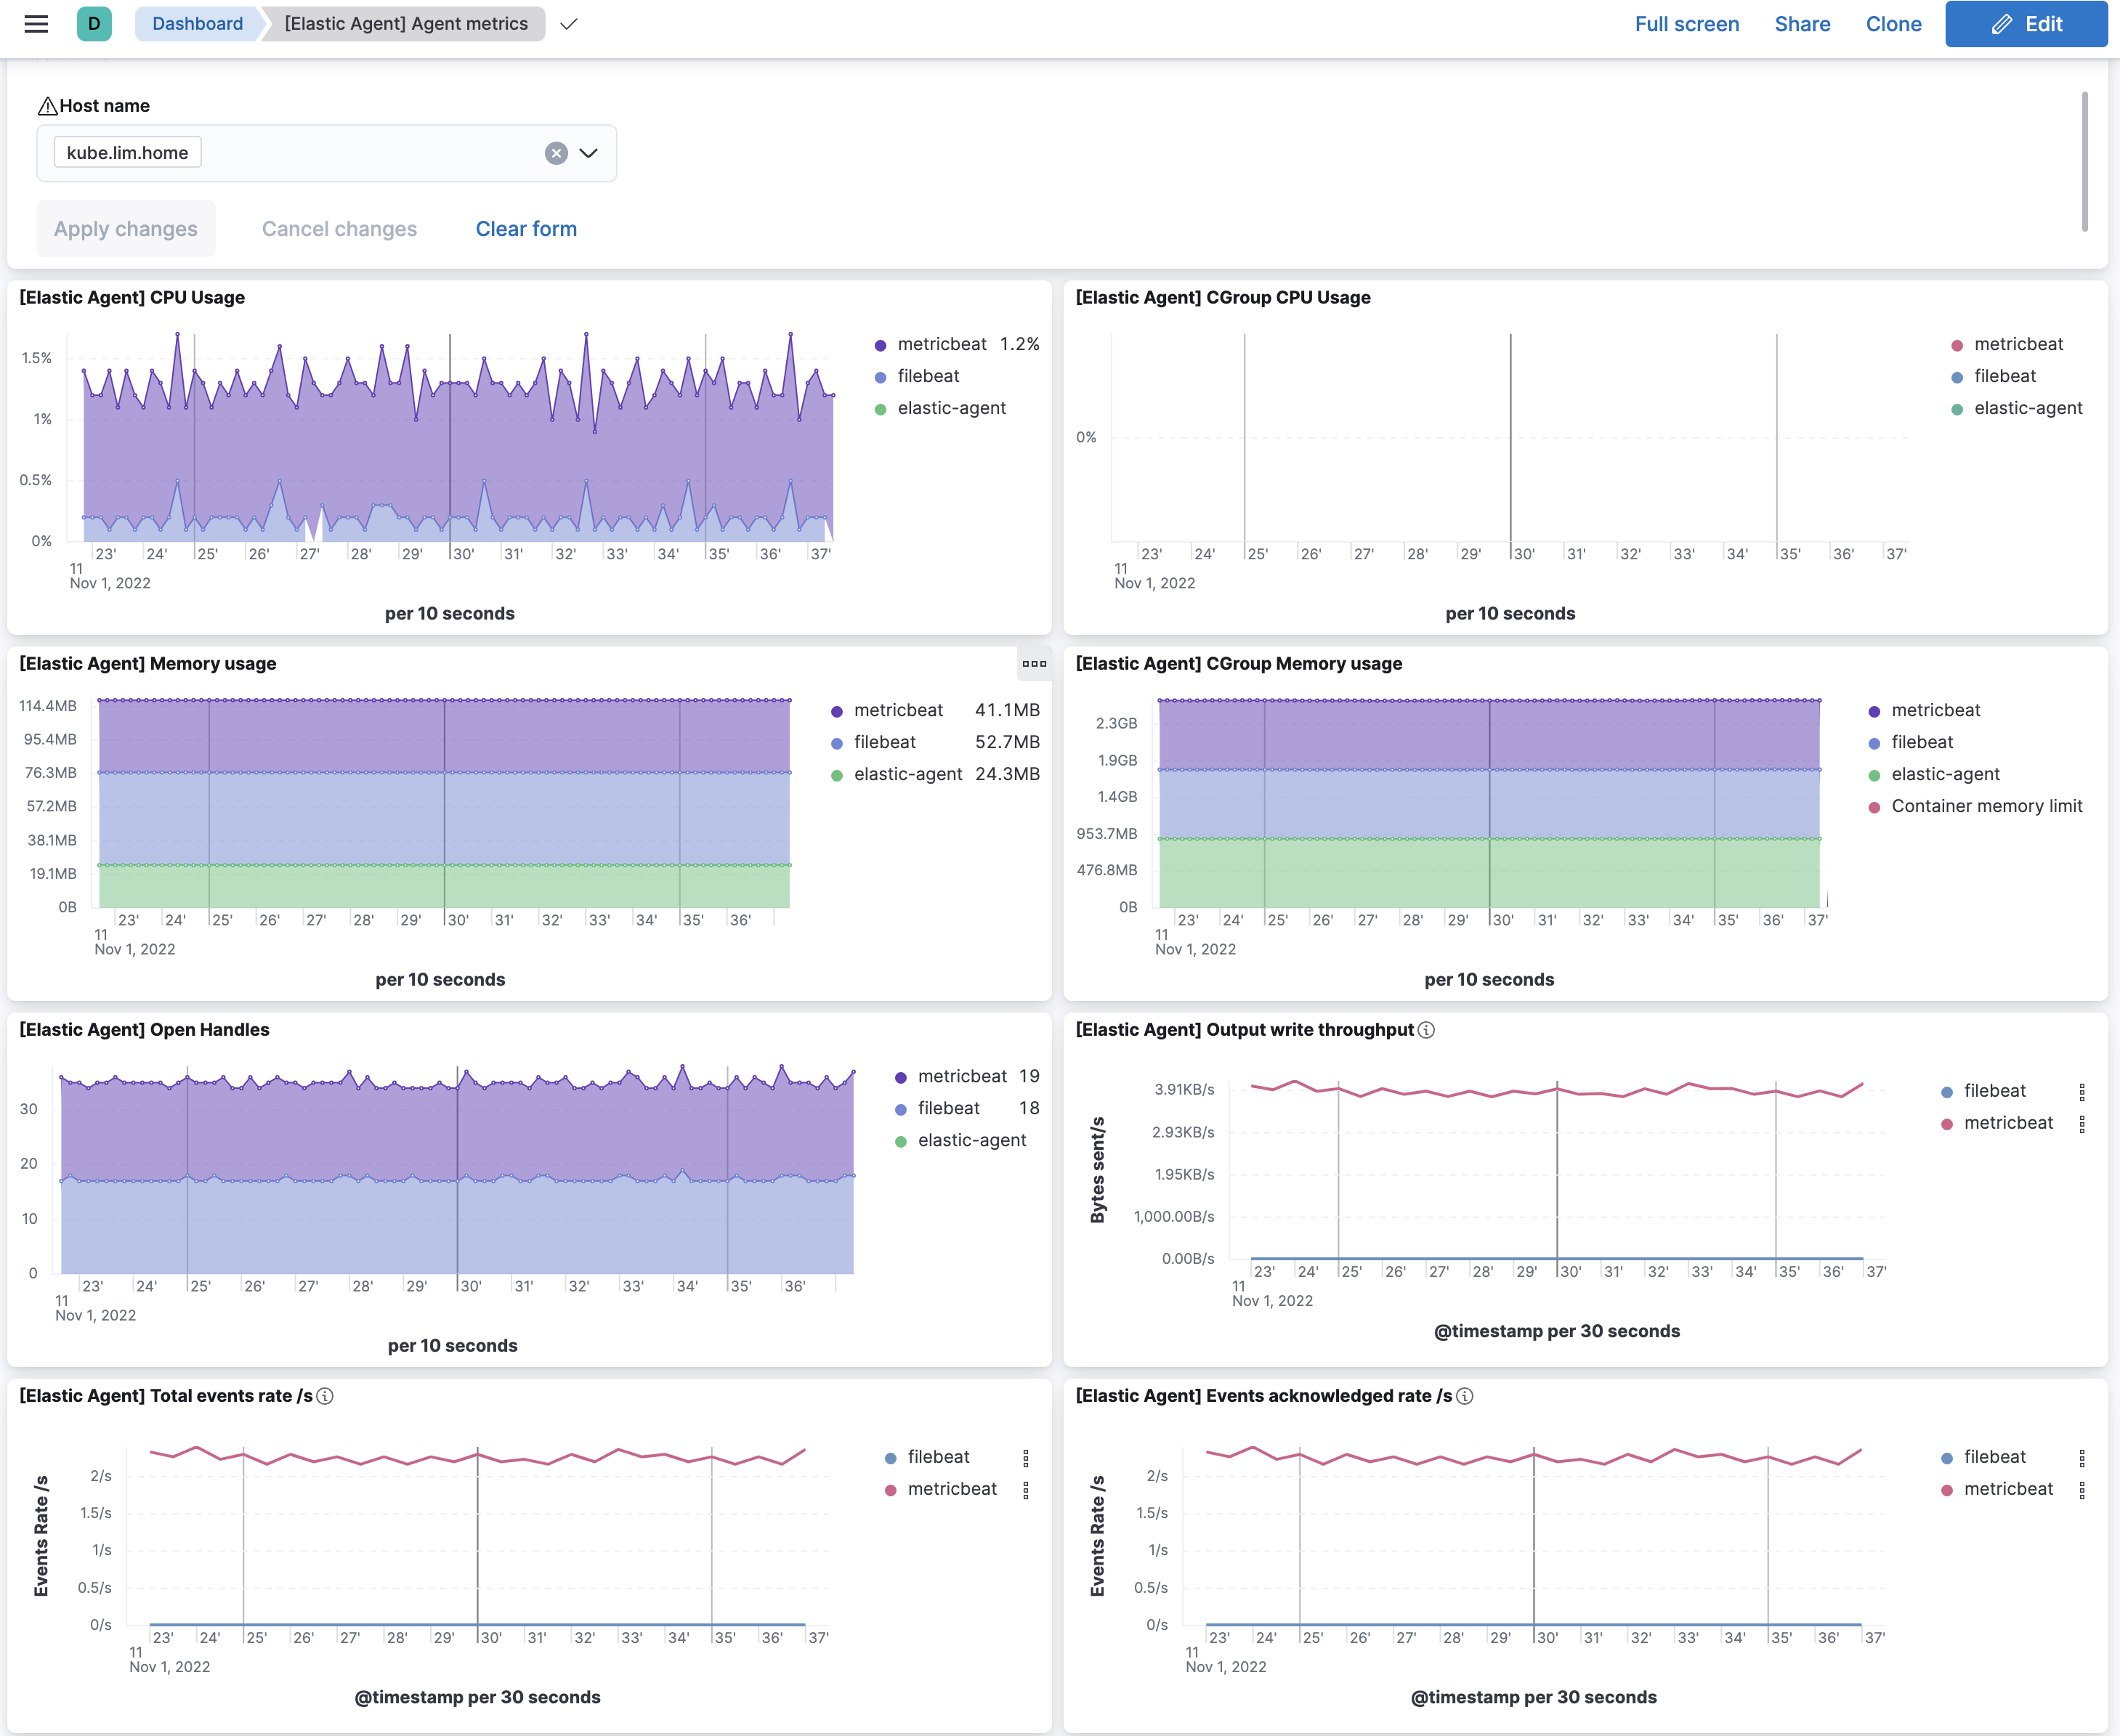
elastic-agent
For elastic-agent monitoring itself, you can view a dashboard called [Elastic Agent] Agent metrics Dashboard on your production cluster. It will have a dropdown for individual elastic-agent and have metrics about the elastic-agent and the beats/endpoint agents
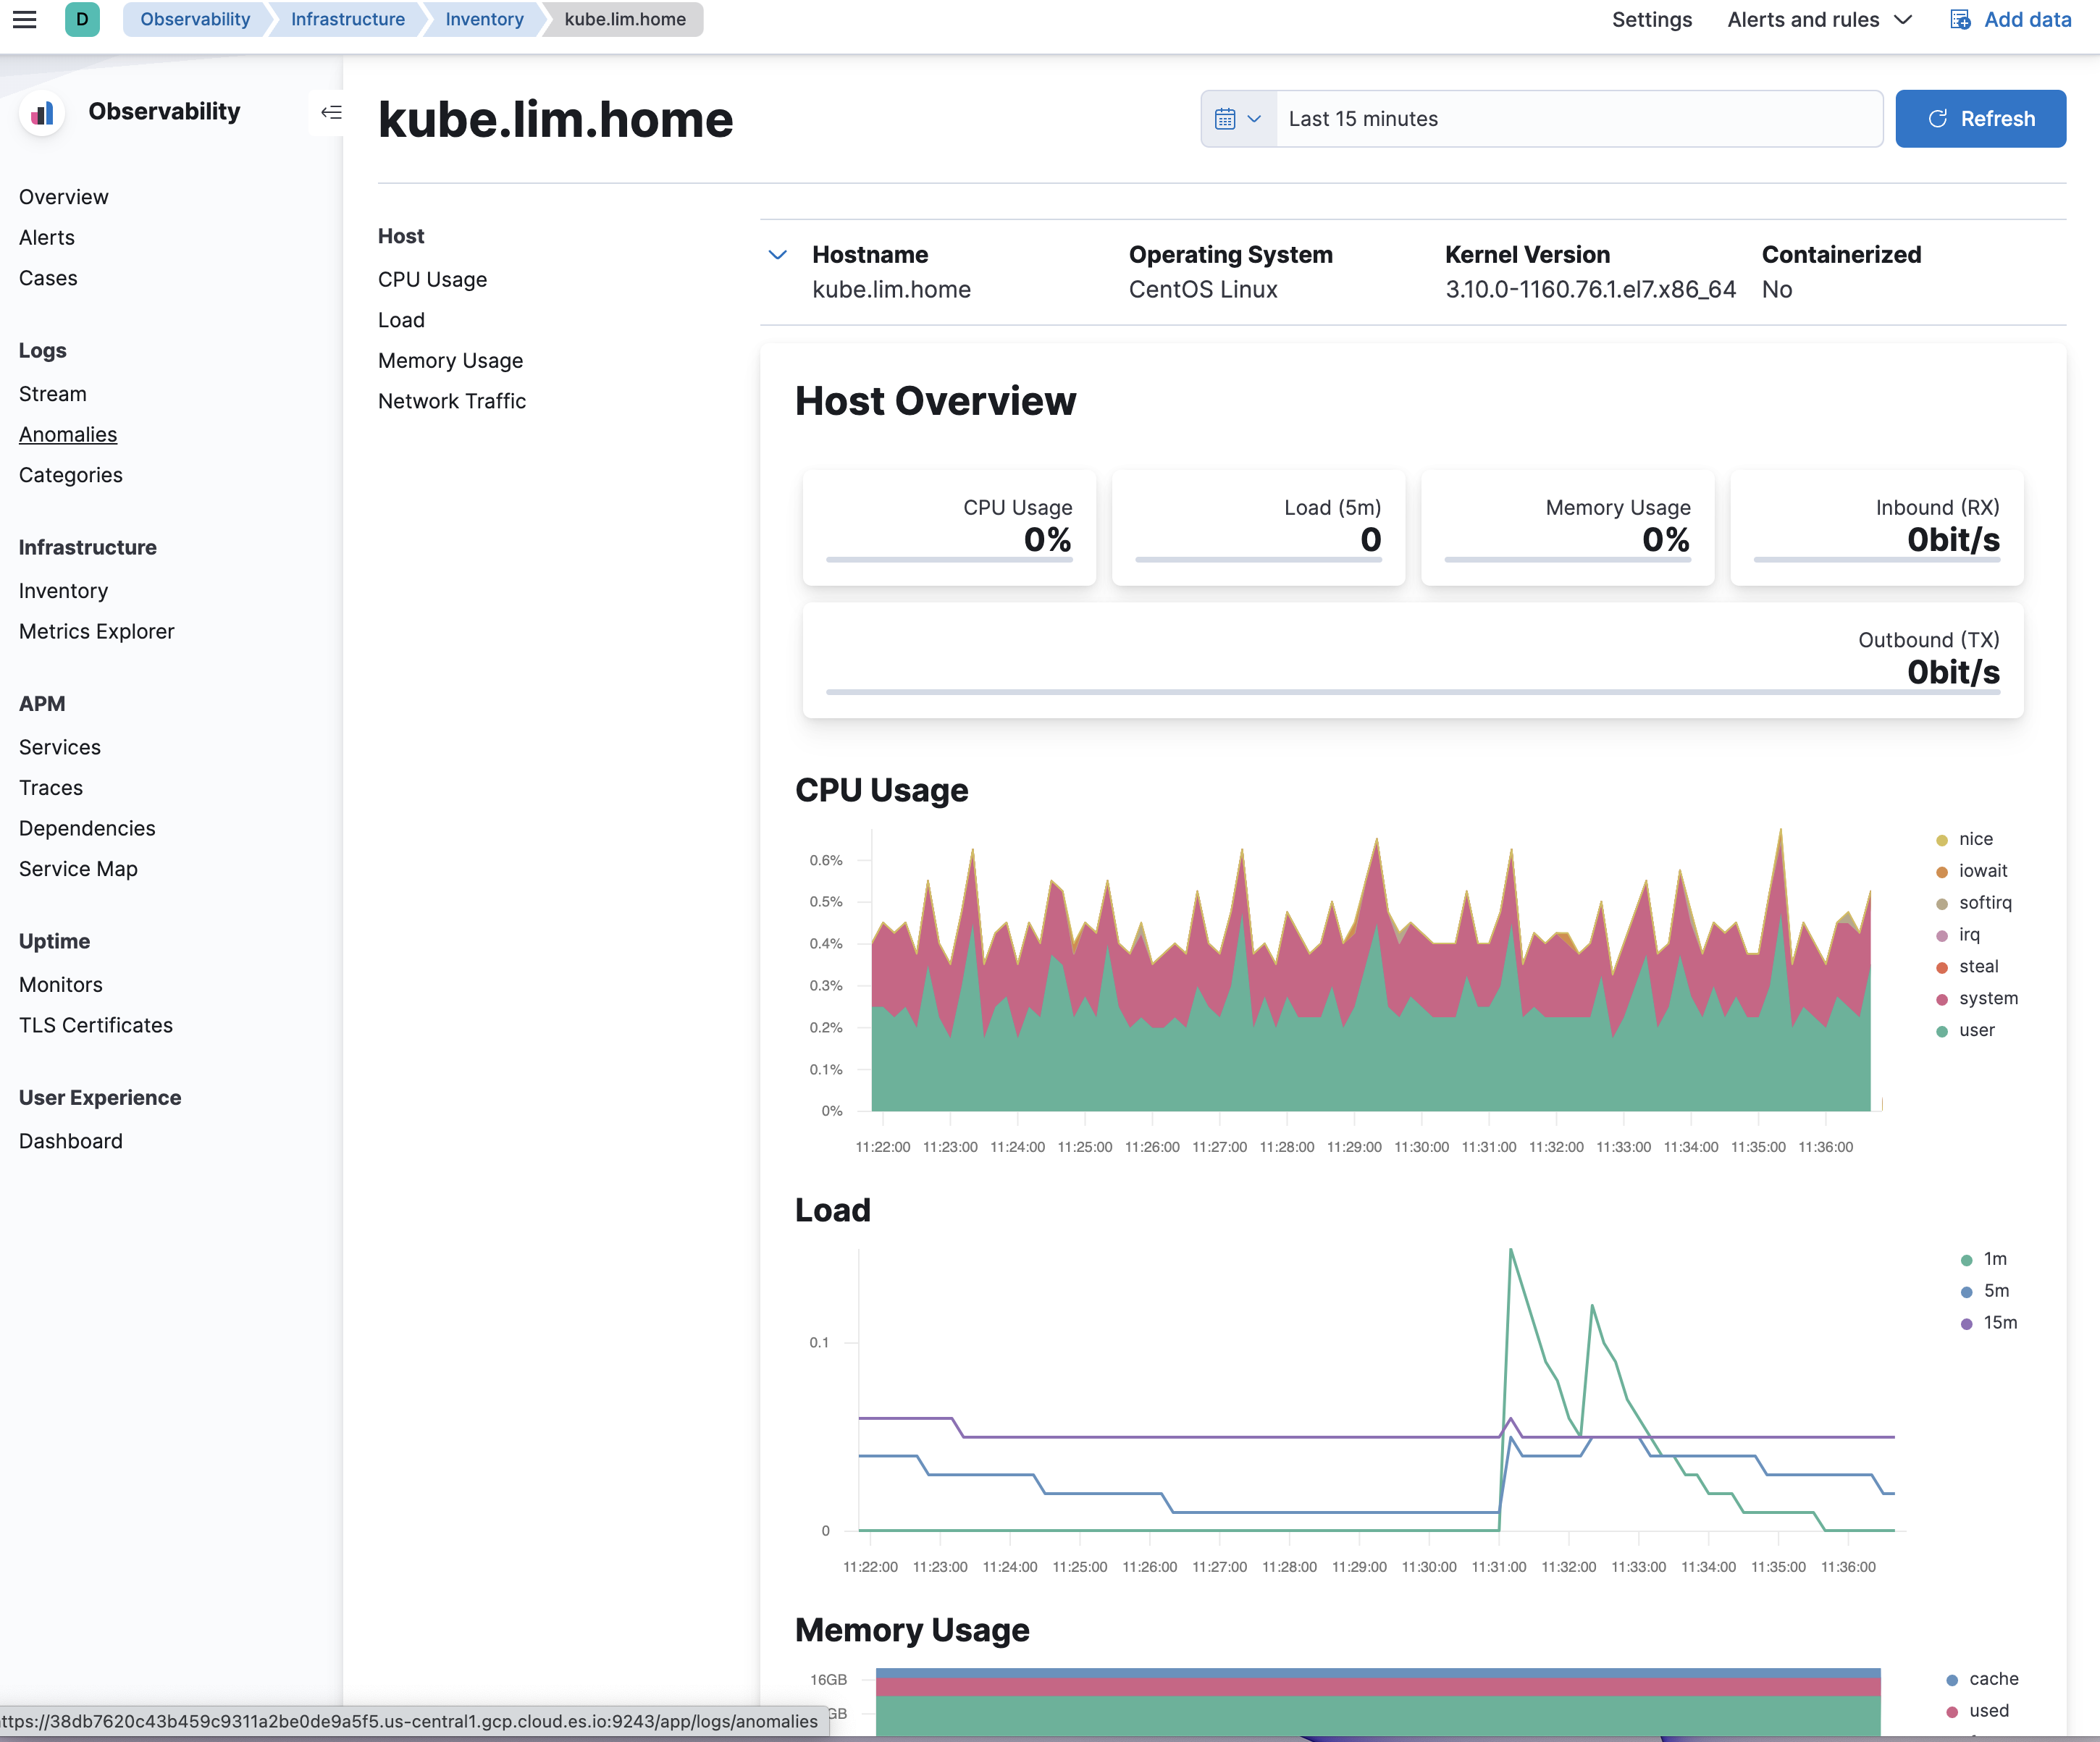
host that elastic-agent runs on
For the host metrics for the endpoint that elastic agents runs on you can goto Kibana -> Observability -> Infrastructure and select the host and click on metrics -> Open as Page to view the host’s CPU/load/memory/network usage
One Comment